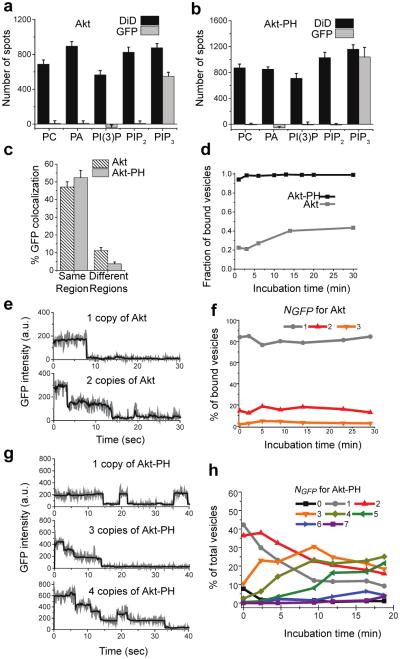
Figure 4. Characterization of Akt and Akt-PH binding to PIP3 lipid vesicles.
(a,b) Quantification of Akt pull-down by various lipid vesicles. Error bars: SD of data from 10 or more imaging areas. (c) Colocalization of Akt and Akt-PH (GFP) with PIP3 vesicles (DiD) from the same region or different regions is shown as percentage of GFP spots that overlapped with DiD spots. (d) Binding of Akt and Akt-PH to PIP3 vesicles over incubation time is shown as fraction of bound vesicles. (e) GFP photobleaching traces of 1 and 2 copies of Akt bound to PIP3. (f) Distribution of Akt stably bound on PIP3 vesicles at various NGFP over incubation time. (g) GFP photobleaching traces of 1, 3, and 4 copies of Akt-PH bound to PIP3. (h) Distribution of Akt-PH stably bound on PIP3 vesicles at various NGFP over incubation time.

