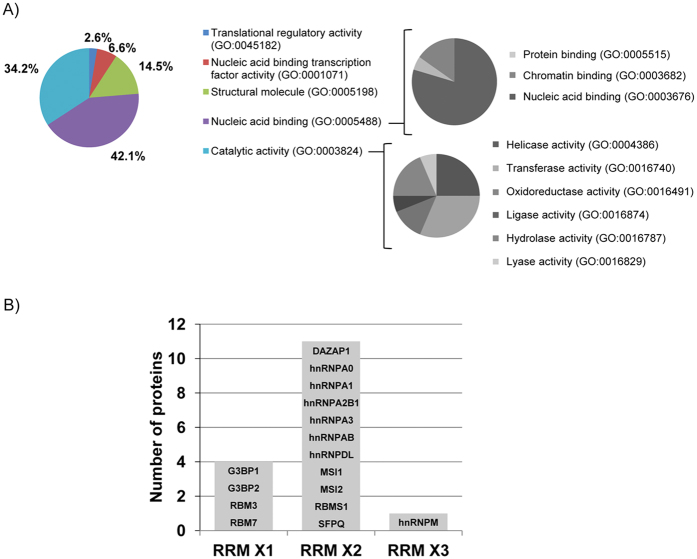
Figure 2. Classification of CRE-interacting protein candidates.
(A) Panther pie-chart showing the classification of the 55 proteins identified in terms of their molecular function. The two main GO terms were subclassified under the same criterion (pie charts on the right). GO term codes are shown in brackets. (B) Classification of RNA-binding proteins via search of the RBPDB database, represented in terms of the number of RRMs. Protein names correspond to the gene names shown in Table 1.

