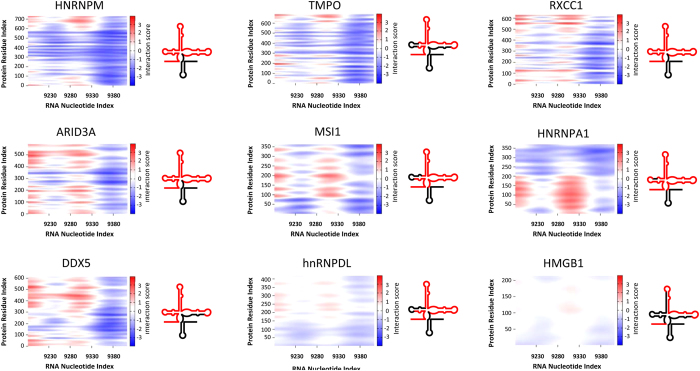
Figure 5. Heat-maps of aminoacid-nucleotide interactions.
Nine proteins were subjected to interaction studies against the CRE sequence using the catRAPID graphics tool. Aminoacid-nucleotide interactions for the whole protein and RNA sequences are represented as heat-maps that show interacting score values between −3 and +3. The strongest interacting regions correspond to the red areas; blue areas represent pairs showing weak aminoacid-nucleotide interaction. The CRE regions corresponding to nucleotides with high interaction values are highlighted in red in the chart on the right.

