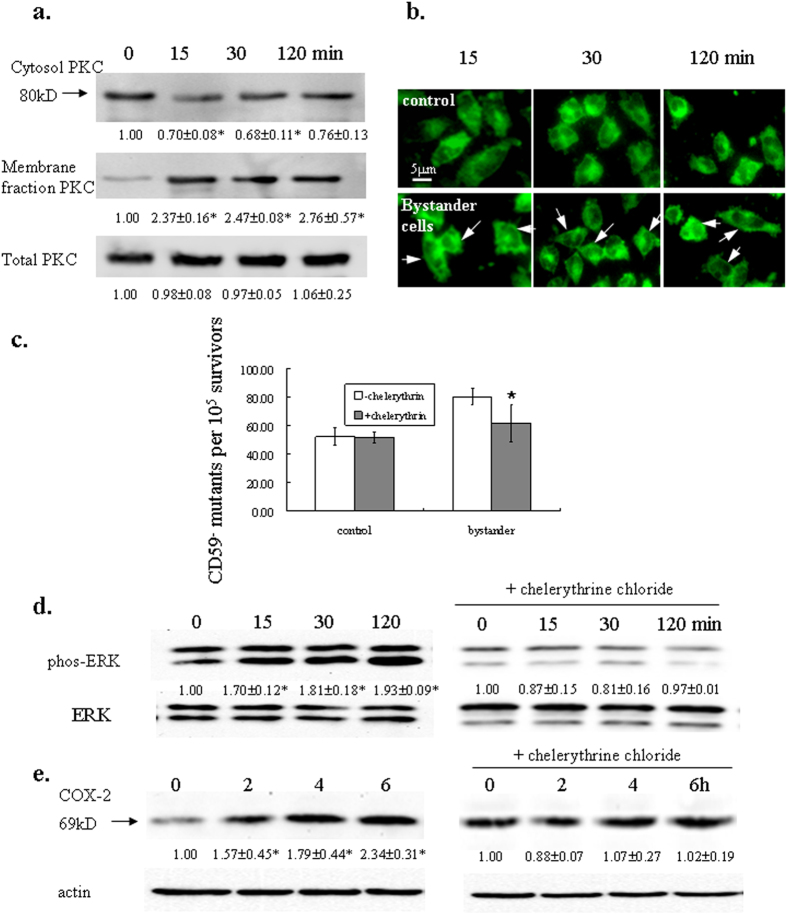
Figure 1. PKC translocation is involved in radiation-induced bystander effect.
(a,b) PKCα expression in different fractions of bystander AL cells. Cells were irradiated with a 50-cGy dose and cells on the aluminum-wrapped half of the dish were collected at time points indicated. Membrane fraction proteins were extracted and separated with SDS-PAGE, transferred to PVDF membrane and probed with PKCα antibody (a). Three independent experiments were performed and a representative blot was shown. Ratios of the corresponding band intensity compared with that of untreated control were measured and calculated with Image J and indicated under each band. Asterisk indicates significant difference between untreated control and the treated groups (p < 0.05). In (b), cells were fixed with 4% paraformadehyde, probed with PKCα antibody followed by detection with Alexa Fluor 488 secondary antibody. (c) Effect of PKC inhibitor chelerythrine chloride on the mutagencity of bystander cells. Exponentially growing AL cells were irradiated as described above. Chelerythrine chloride (10 μM) was added into the cultures 1 hr before irradiation. Data are pooled from four independent experiments. Bars indicate ± S.D. of means. Asterisk indicates significant difference between the treated and untreated control (p = 0.03). (d.e) Effect of chelerythrine chloride on ERK activity and COX-2 expression. Proteins from bystander cells were extracted with RIPA buffer at the indicated time points after irradiation and probed with phosphor-ERK1/2 or COX-2 antibody. Left panels, untreated controls; right panels, cells were treated with chelerythrine chloride before irradiation. Three independent experiments were performed and a representative blot was shown. Ratios of the corresponding band intensity compared with that of untreated control were measured and calculated with Image J and indicated under each band. Asterisk indicates significant difference between untreated control and the treated groups (p < 0.05).

