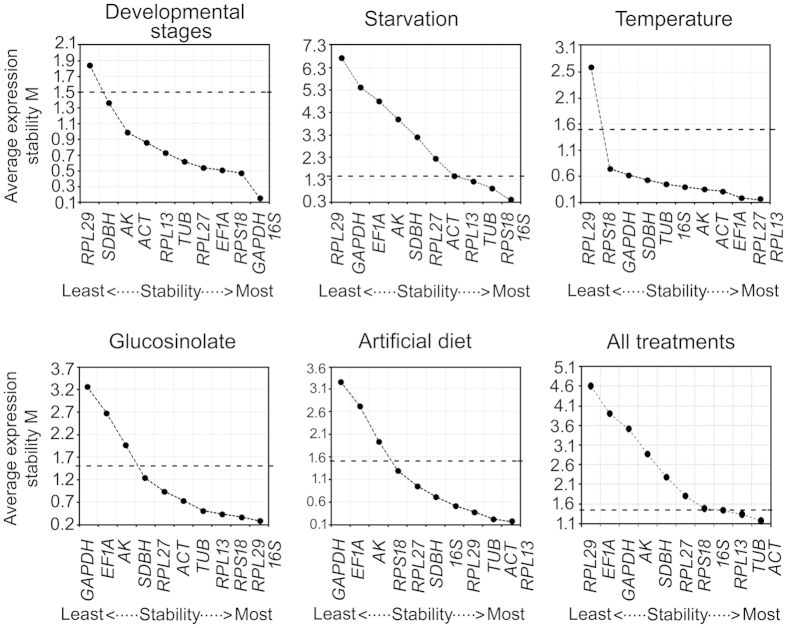
Figure 4. Expression stability and relative ranking of the 11 reference genes predicted by the geNorm.
The mean expression stability (M) was calculated by stepwise exclusion of the least stable gene across all the samples within a particular group set. The mean stability of different genes is plotted; the least stable genes are represented on the left and the most stable on the right side of the plot. The dotted line indicates the threshold value of mean expression stability. The genes with M ≤ 1.5 are considered significant with stable expression.

