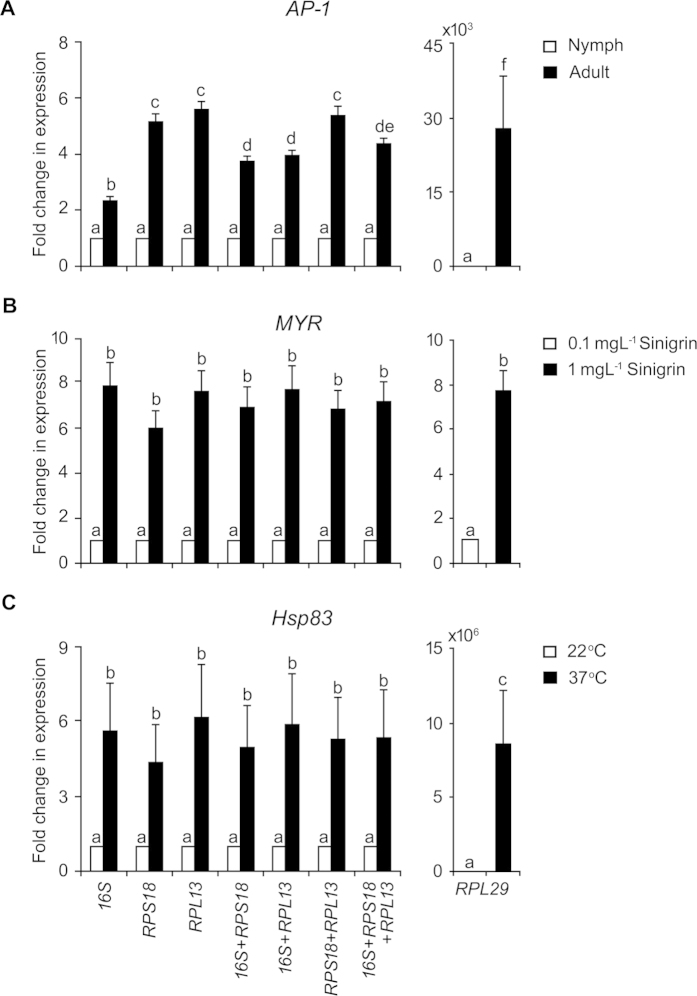
Figure 6. Variation in AP-1, MYR and Hsp83 gene-expression data normalized by different reference genes and their combinations.
Fold change in AP-1, MYR and Hsp83 transcripts in aphids subjected to treatments of developmental stage (A), sinigrin (B) and temperature stress (C), respectively. Stable reference genes 16S, RPS18, RPL13, their combinations and least stable reference gene RPL29 were independently used as normalizer. Values represent mean ± SE (3n = 9) and comparison of means was carried out by student’s t test (P < 0.05). Different letters indicate significantly different values.

