Figure 5.
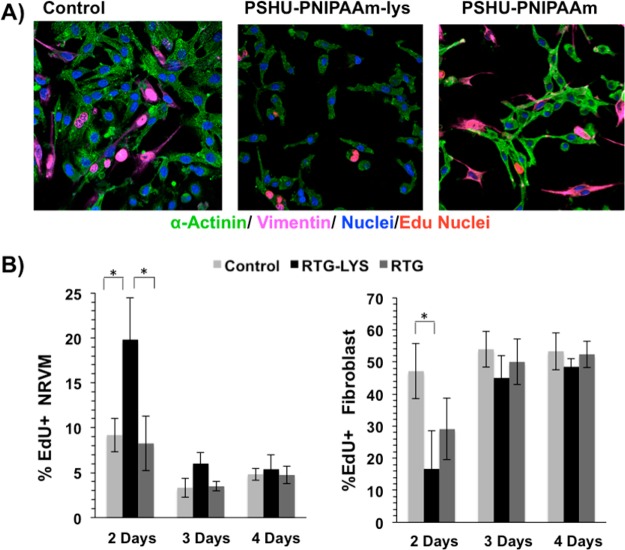
Proliferation assay of NRVM and fibroblast. Fluorescence staining: sarcomeric α-actinin (green), vimentin (magenta), DAPI (blue), and EdU (pink nuclei). (A) From right to left: NRVM and fibroblast cultured on 2D tissue culture plate coated with gelatin (control), 3D PSHU-PNIPAAm-lysine and 3D PSHU-PNIPAAm. (B) Significant differences of dividing NRVMs on the PSHU-PNIPAAm-lysine system were observed at day 2 when compared with the gelatin controls (P = 0.02) and with the PSHU-PNIPAAm scaffold (P = 0.02). Significant differences of dividing fibroblast were observed at day 2 between the gelatin controls and the RTG biopolymers. * indicates p value < 0.05 (Student’s test). Data are presented as mean ± SD (n = 5).

