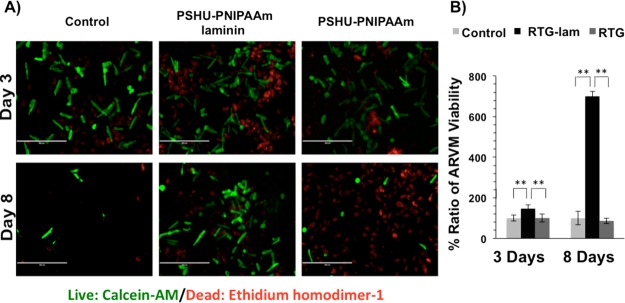
Figure 7.
Live/dead (green/red) staining of ARVM after 3 and 8 days of culture in different conditions: (A) from left to right 2D tissue culture plate coated with laminin (control), 3D PSHU-PNIPAAm-laminin, and 3D PSHU-PNIPAAm. Top-row panels ARVM after 3 days of culture. Bottom-row panels ARVM after 8 days of culture. (B) Compared to control groups, a notable improvement of ARVM viability was observed in the PSHU-PNIPAAm-aminin after 3 and 8 days of culture. ** indicates p value < 0.01 (Student’s test). Three days of culture: PSHU-PNIPAAm-laminin compared to (1) control p value: 0.0006 and (2) PSHU-PNIPAAm p value: 0.0005. Eight days of culture: PSHU-PNIPAAm-laminin compared to (1) control p value: 0.0004 and (2) plain PSHU-PNIPAAm p value: 0.0003. Data are presented as mean ± SD (n = 5).

