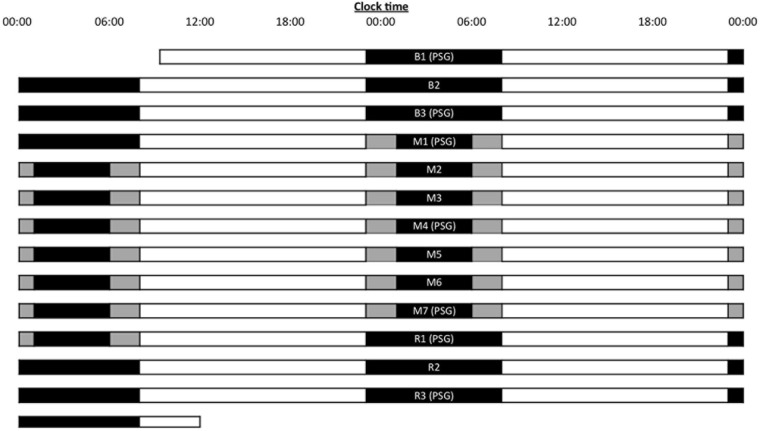
Figure 1.
Two-week experimental protocol illustrated in a double raster plot. Both SR and Control groups underwent 3 baseline nights of 9 h sleep opportunity (B1 to B3), followed by 7 nights of either 5 h (SR; black bars) or 9 h (Control; gray bars) sleep opportunity (M1 to M7), and ending with 3 recovery nights of 9 h sleep opportunity (R1 to R3). Nights where polysomnography (PSG) was recorded are indicated on the plot.

