
Figure 2.
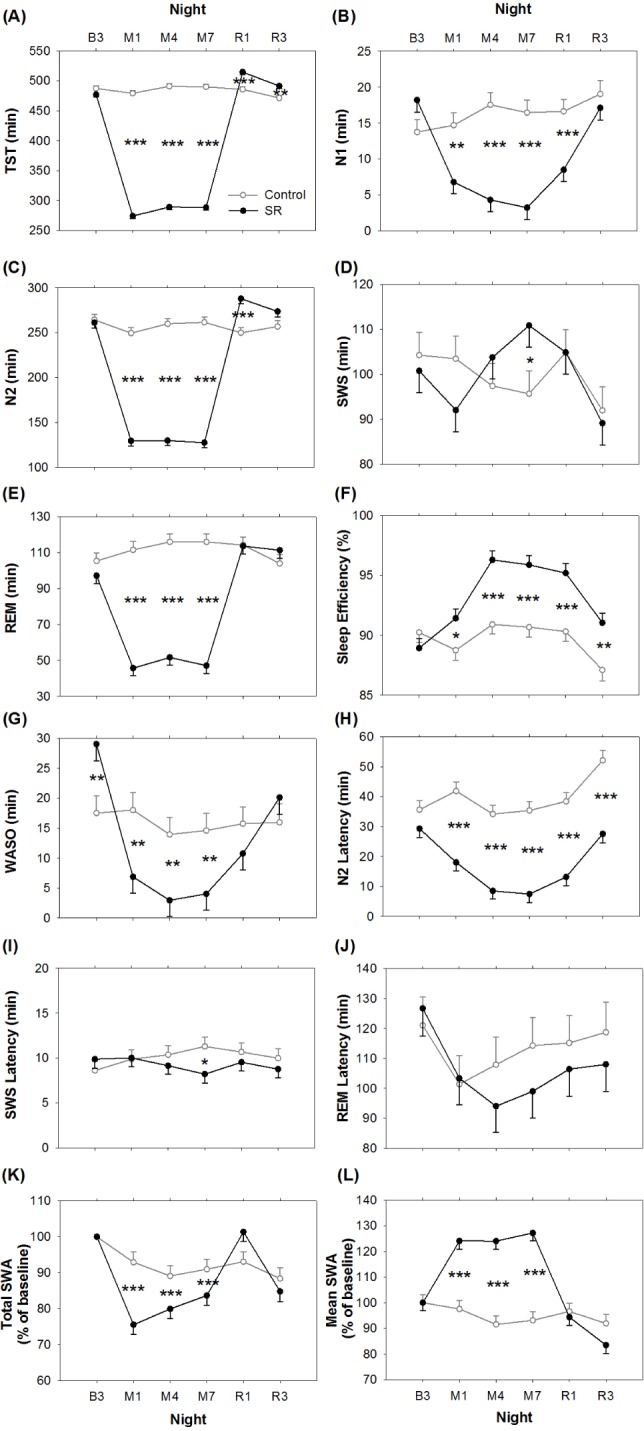
Effects of sleep restriction on sleep macrostructure and SWA power across experimental nights. Mean ± SEM of the SR (black filled circles) and the Control (gray open circles) groups were plotted for the last baseline night (B3), first, fourth, seventh sleep manipulation nights (M1, M4, and M7), and first and third recovery nights (R1 and R3). Asterisks indicate significant differences between groups for each night (*P < 0.05, **P < 0.01, ***P < 0.001).