
Figure 4.
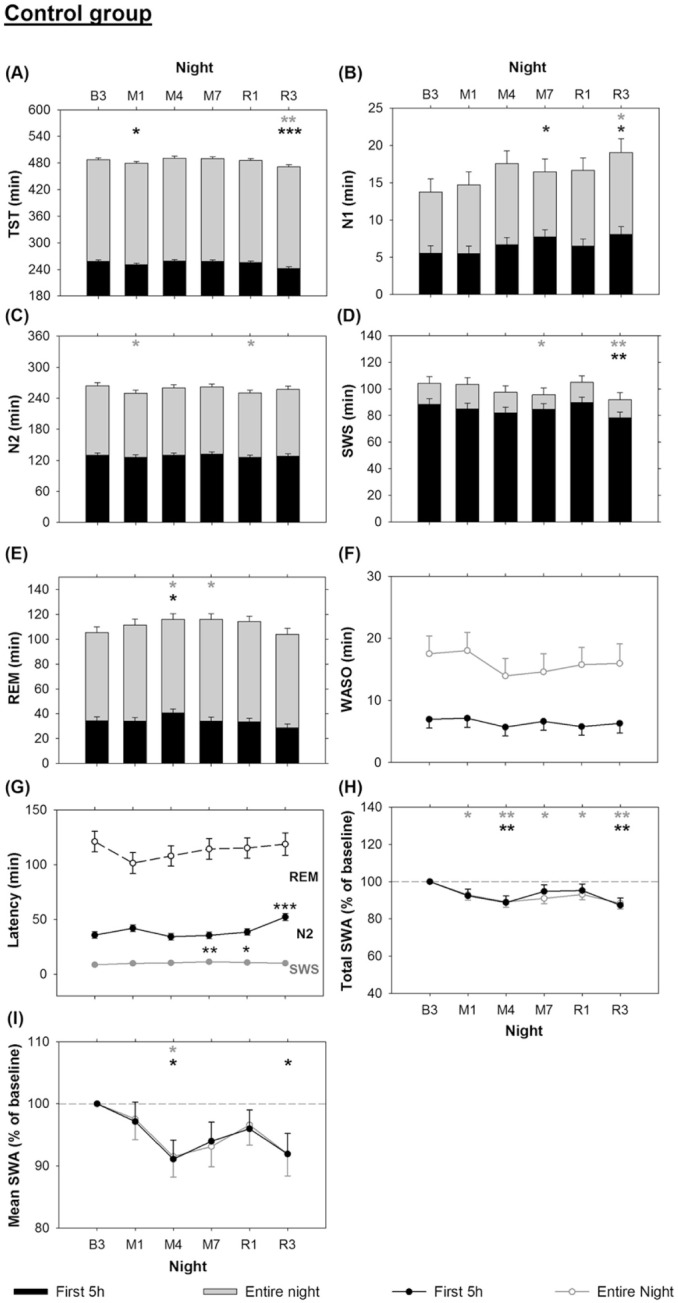
Sleep macrostructure and SWA power of the Control group. Black bars indicate mean ± SEM of sleep variables in the first 5 h of sleep for all nights, while gray bars indicate mean ± SEM in the remainder of full sleep (9 h for B3, R1, and R3). Black asterisks indicate significant differences from B3 considering only the first 5 h of sleep while gray asterisks indicate differences from B3 considering the full sleep opportunity. (*P < 0.05, **P < 0.01, ***P < 0.001).