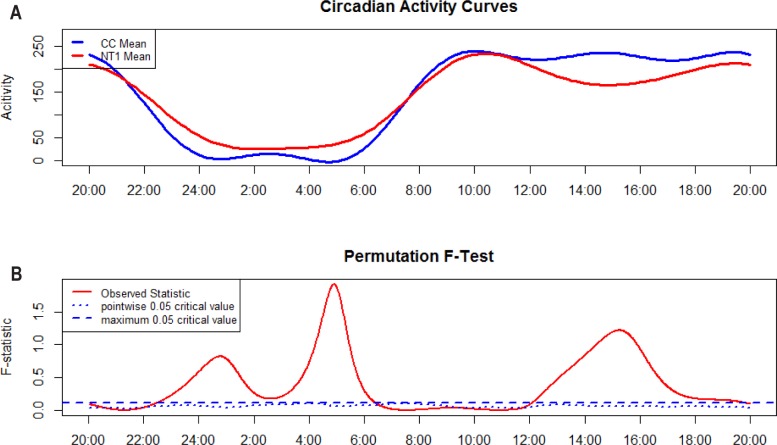
Figure 1.
Functional linear modeling for NT1 and controls. Plot (A) shows estimated activity patterns for the two groups. Plot (B) shows F-test result, the red curve represents the observed statistic, and the blue dashed and dotted lines correspond to a global and point-wise test of significance at α = 0.05. NT1, type 1 narcolepsy; CC, controls.

