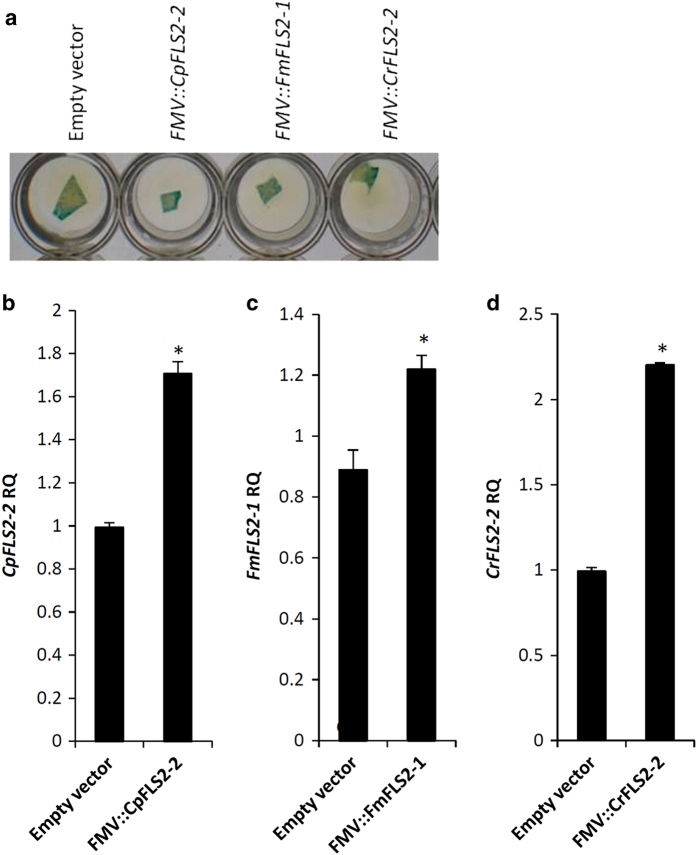
Figure 7.
Evaluation of the transient expression using GUS assays (a) and RT–qPCR (b–d). Agroinfiltrated ‘Duncan’ grapefruit leaves were collected 3 days after infiltration and leaf segments were used in a GUS histochemical staining assay. Leaf segments were also evaluated for transgene expression using RT–qPCR. RQ values are the relative quantification of gene expression 3 days after agroinfiltration. An asterisk indicates RQ value of the transgene is significantly different (P<0.05) from the control (empty vector). Bars are means of replicates±s.e. (n=3). GUS, β-glucuronidase histochemical staining assay; RT–qPCR, quantitative reverse transcription–PCR.

