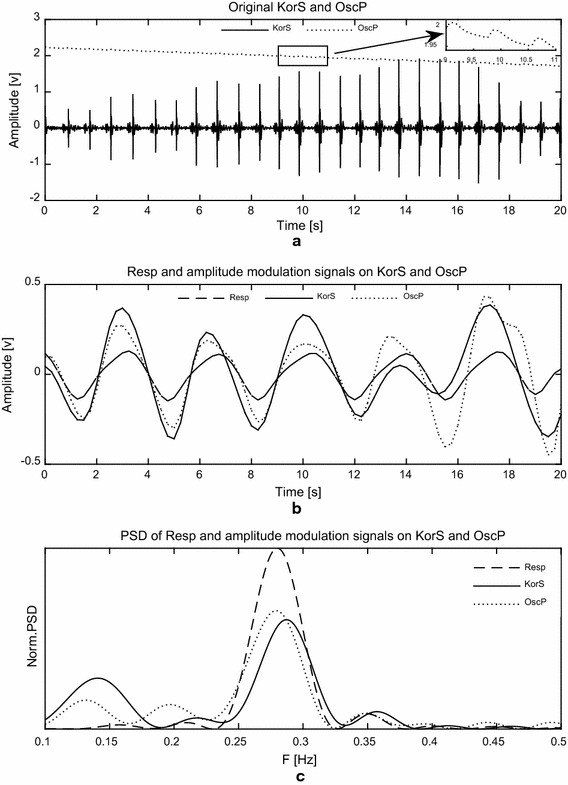
Fig. 1.

Signal processing procedure to analyze the amplitude modulation effect of respiration on OscP and KorS. a Original OscP (dotted line) and KorS (solid line) acquired during cuff deflation between SBP and DBP. The OscP signal between 9 and 11 s (marked with rectangular) is zoomed in and shown on the top-right corner of panel; b Reference Resp signal (dashed line) and amplitude modulation signals on OscP (dotted line) and KorS (solid line); and c normalized power spectral density of Resp (dashed line) and amplitude modulation signals on OscP (dotted line) and KorS (solid line)
