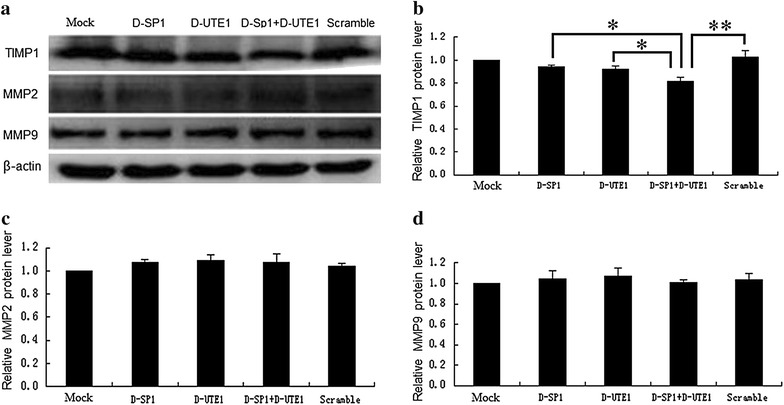
Fig. 2.

The expression of TIMP1, MMP2 and MMP9 dealed with SP1 and UTE1 Decoy ODNs by western blot assay. D-SP1 SP1 Decoy ODN, D-UTE1 UTE1 Decoy ODN, Scramble Scr Decoy ODN. Data are presented as the mean ± SD of three experiments. *p < 0.05 and **p < 0.01. The β-actin protein served as control and band intensities were normalized to β-actin in the quantificative analysis. a The expression of TIMP1, MMP2 and MMP9 were analysed by western blot assay when SP1 and UTE1 Decoy ODNs were transfected into HSC-T6 cells for 48 h. b Quantification of TIMP1 expression in HSC-T6 cells by western blot showed an obvious decrease (p = 0.001) in average band intensity with mixture group of SP1 and UTE1 Decoy ODNs, compared with scramble control, while quantification of TIMP1 expression did not show significant decreases comparing group of SP1 Decoy ODN (p = 0.153) or group of UTE1 Decoy ODN (p = 0.071) to scramble control, respectively. There are significant decreases comparing group of mixture group of SP1 and UTE1 Decoy ODNs with group of SP1 Decoy ODN (p = 0.026) and group of UTE1 Decoy ODN (p = 0.036), respectively. c Quantification of MMP2 expression in HSC-T6 cells by western blot did not show significant changes (p > 0.05) among them. d Quantification of MMP9 expression in HSC-T6 cells by western blot did not show significant changes (p > 0.05) among them
