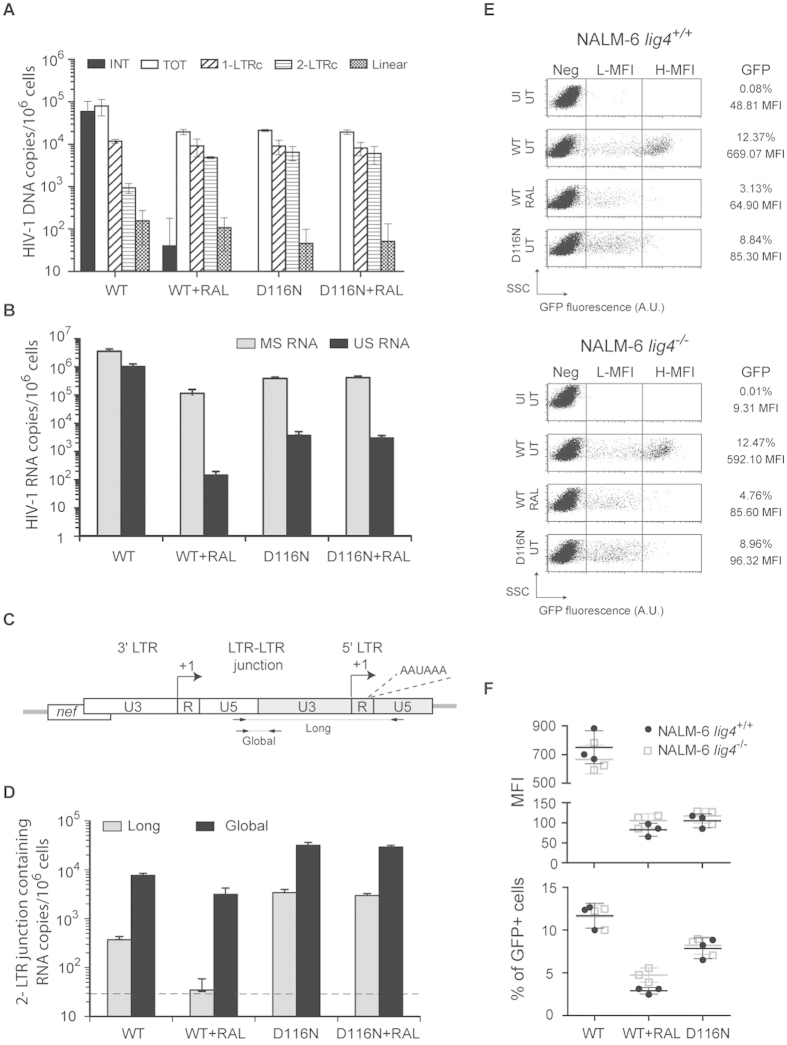
Figure 2. Expression of circular uDNAis mainly supported by 1-LTRc.
(A–D) Quantification of RNA production from uDNA. MT4 T-cells were infected with HIV-1 env−gfp+ harboring either wild-type (WT) or a catalytically defective (“D116N”) integrase, each pseudotyped with VSV-G protein (≈m.o.i. 0.1), in the absence or presence of 200 nM RAL. Three days later, quantitative-PCR (qPCR) and RT-qPCR were performed to quantify viral DNA species (total, linear, 1-LTRc and 2-LTRc – panel (A)) along with unspliced (US, genomic viral RNA) and multi-spliced (MS, encoding accessory proteins) HIV-1 RNAs (panel (B)), and mRNAs containing the 2-LTRc junction (panel (C,D)). Primers and probes used to amplify long or total 2-LTR mRNAs are presented in panel (C). Of note, these RT-qPCRs allowed the specific quantification of mRNAs containing the 2-LTR junction, but did not quantify the entire expression from 2-LTRc given that transcripts can also be produced from the 5′-LTR (but are in this latter case undistinguishable from RNA produced from other HIV DNA templates). In panel (D), the grey line represents the detection threshold of long 2-LTR RNAs. The results are expressed in copies per million cells. They were obtained from 3 independent experiments (mean ± confidence intervals for a p value < 0.05). (E,F) Transgene expression depending on viral integrase and host ligase 4 activities. NALM-6 cells, proficient (lig4+/+) or deficient (lig4−/−) in ligase 4 activity, were infected with HIV-1 env− gfp+ harboring either wild-type (WT) or a catalytically defective integrase (“D116N”), each pseudotyped with VSV-G protein (≈m.o.i. 0.1), in the absence (“UT”) or presence of 200 nM RAL (“RAL”). Three days later, cytofluorometry was employed to determine the percentage and mean fluorescence intensity (MFI) of GFP expression. Dot plots show GFP fluorescence (expressed in arbitrary units, A.U.) depending on the Side-Scatter light (SSC). One representative experiment (panel (E)) and the results of 3 independent experiments (barplots - panel (F)) are presented. Other abbreviations: H-MFI: high MFI, L-MFI: low MFI; Neg: negative cells; UI: uninfected cells.

