Figure 1.
Isolation, Characterization, and Complementation of the Arabidopsis Mutants pam71-1 and pam71-2.
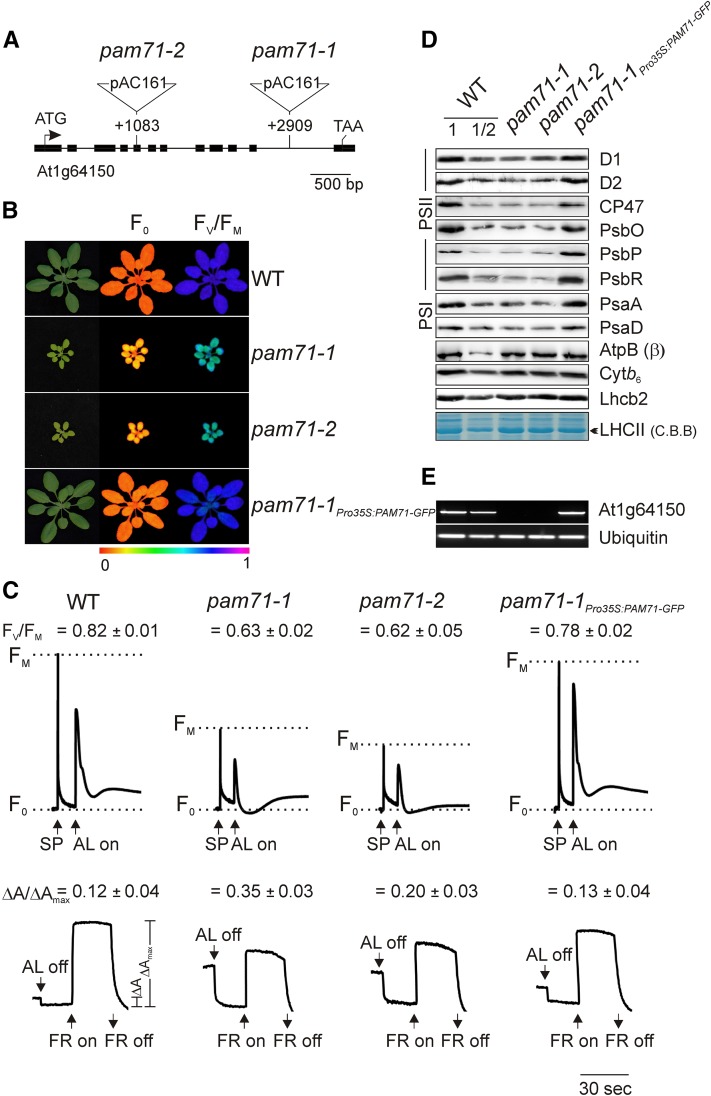
(A) T-DNA tagging of the PAM71/At1g64150 locus. Exons are shown as black boxes and the introns as black lines. Start and stop codons are indicated. The pam71-1 and pam71-2 alleles were identified in the GABI-Kat collection (GK-166A05 and GK-094C03). Locations of T-DNA insertions are indicated with respect to the start codon. Note that the insertions are not drawn to scale.
(B) Four-week-old wild-type plants, mutants (pam71-1 and pam71-2), and the complemented line pam71-1Pro35S:PAM71-GFP were grown in a 12-h/12-h dark/light cycle at 21°C/18°C and at 90 µmol photons m−2 s−1, and the minimal chlorophyll a fluorescence (F0) (middle panel) and maximum quantum yield of PSII (FV/FM) (right panel) were recorded. The color scale at the bottom indicates the signal intensities.
(C) Chlorophyll a fluorescence induction curves (top panel) and P700 redox kinetics (bottom panel) were recorded from leaves of the different genotypes. FV/FM values are indicated for each genotype. For chlorophyll a fluorescence measurement, the minimal level of fluorescence of dark-adapted leaves is indicated by dashed lines. Saturating pulses (SP) and actinic light (AL; 100 µmol photons m−2 s−1) were applied as indicated. For P700 absorption measurements, leaves were first illuminated with actinic light (100 µmol photons m−2 s−1) for 4 min, and absorbance changes (at 830 nm) induced by exposure to far-red light (FR; 720 nm) were recorded. Mean values (±sd) are each based on five individual plants.
(D) Immunodetection of thylakoid proteins from the different genotypes using antibodies raised against individual subunits of PSII (D1, D2, CP47, PsbO, PsbP, and PsbR), LHCII (Lhcb2), PSI (PsaA and PsaD), the Cytb6f complex (Cytb6), and chloroplast ATP synthase [AtpB (β) subunit]. Samples equivalent to 15 µg protein were loaded in all lanes, except in those marked WT 1/2, where only half as much was loaded. As a loading control, LHCII was visualized by Coomassie blue (C.B.B.) staining.
(E) Expression of PAM71/At1g64150 in the different genotypes, as determined by RT-PCR (30 cycles). Primers used for amplification were complementary to sequences within the 3rd and 12th exons. The expression of Ubiquitin (At4g36800) was used as a control for RNA integrity.

