Figure 3.
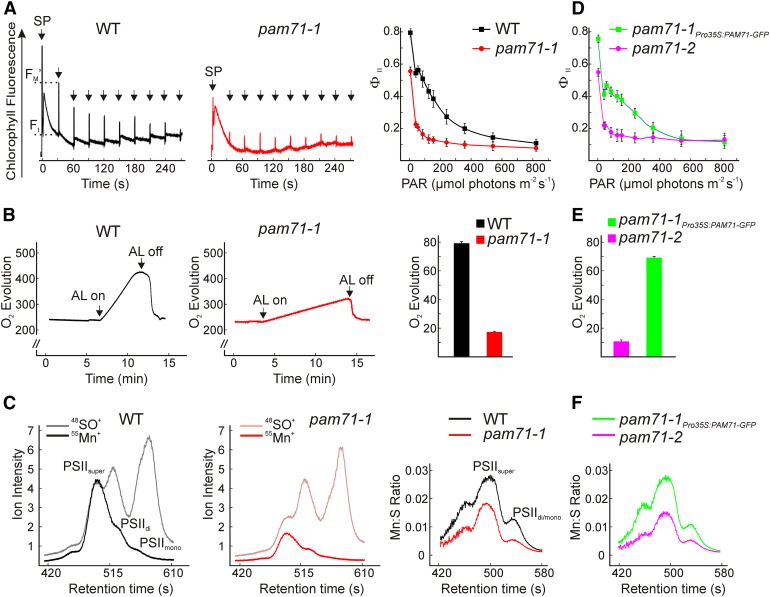
Effective Quantum Yield of PSII, Oxygen Evolution, and Multielement Chromatogram of the Wild Type, pam71-1, pam71-2, and pam71-1Pro35S:PAM71-GFP.
(A) Chlorophyll a fluorescence induction curves were recorded in the range 0 to 856 µmol photons m−2 s−1 for the wild type (left panel) and pam71-1 (middle panel) and plotted as values from eight individual plants (±sd) (right panel) displayed as light response curve of the effective quantum yield of PSII ΦII [(FM′ − Ft)/FM′]. Saturating pulses (SP) were applied as indicated. The plants were dark-adapted for 30 min prior to measurement. ΦII was recorded following illumination for 30 s at the appropriate PAR. FM′ and Ft are indicated for the wild type at 37 µmol photons m−2 s−1 (left panel).
(B) Oxygen evolution (nmol O2 mL−1) of the wild type (left panel) and pam71-1 (middle panel) was measured over the indicated time in isolated thylakoids adjusted to 30 µg chlorophyll mL−1 and using DCBQ as an external electron acceptor. Reactions were started with the application of actinic light (AL) at 500 µmol photons m−2 s−1. Oxygen evolution rate (µmol O2 mg chlorophyll−1 h−1) was calculated from two independent thylakoid preparations including three replicates (right panel). The data are means ± sd (n = 6).
(C) Size exclusion profiles were recorded for the nonoxide ion 55Mn+ and the oxide ion 48SO+ in the wild type (left panel) and pam71-1 (middle panel) and given as ion intensities (counts 105 s−1). Individual 55Mn+ fractions were assigned to PSII dimers/monomers = PSIIdi/mono and PSII supercomplexes = PSIIsuper according to Schmidt et al. (2015). Quantification of the Mn:S stoichiometric ratio (as described in Methods) is shown for a representative sample (right panel) out of five samples derived from independent thylakoid preparations.
(D) to (F) Analysis of pam71-2 and pam71-1Pro35S:PAM71-GFP was performed as in (A) to (C), respectively.

