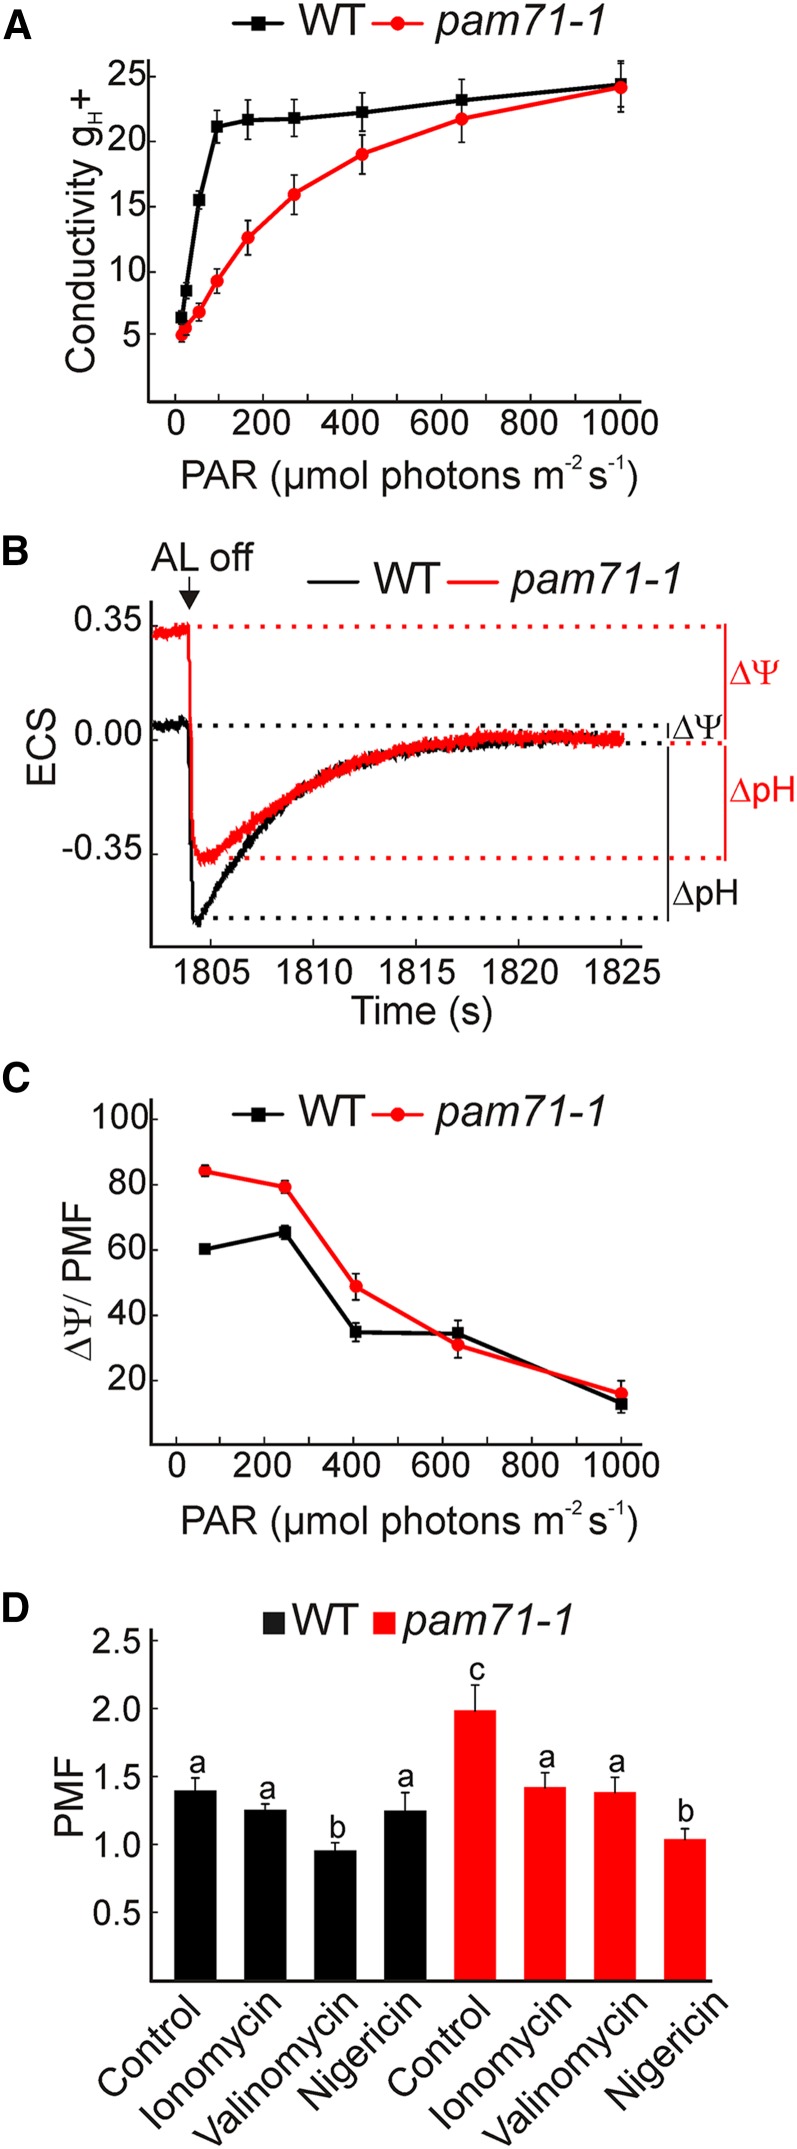
Figure 6.
Membrane Conductivity and PMF Formation of pam71-1 and the Wild Type.
(A) Thylakoid membrane conductivity gH+ (s−1) was determined from plants that were dark-adapted overnight. Leaves were illuminated for 2 min at increasing light intensities in the range of 13 to 1028 µmol photons m−2 s−1 before membrane conductivity was determined from the ECS signal upon switching off the light after each time point. The data are means ± se (n = 9).
(B) ECS (515 to 550 nm ΔI/I 103) was determined after actinic light (AL) was switched off. Before actinic light was switched off, leaves were illuminated for 30 min at 90 µmol photons m−2 s−1. Partitioning of PMF to Δψ and ΔpH is indicated with bars.
(C) PMF partitioning to Δψ (%) was determined after actinic light was switched off following 2 min illumination at the indicated PAR. The data are means ± se (n = 9).
(D) Magnitude of the PMF (ECSt) in the presence of ionophores. Detached leaves were incubated for 30 min in water (control), the ionophores ionomycin (30 µM) and valinomycin (30 µM), or in the presence of nigericin (50 µM) under a growth light, then kept in the dark for 30 min before measurement. To determine ECSt, the treated leaves were illuminated for 2 min at 90 µmol photons m−2 s−1. The data are means ± se (n = 5 to 6). Different letters indicate statistical significance according to ANOVA (P < 0.05).

