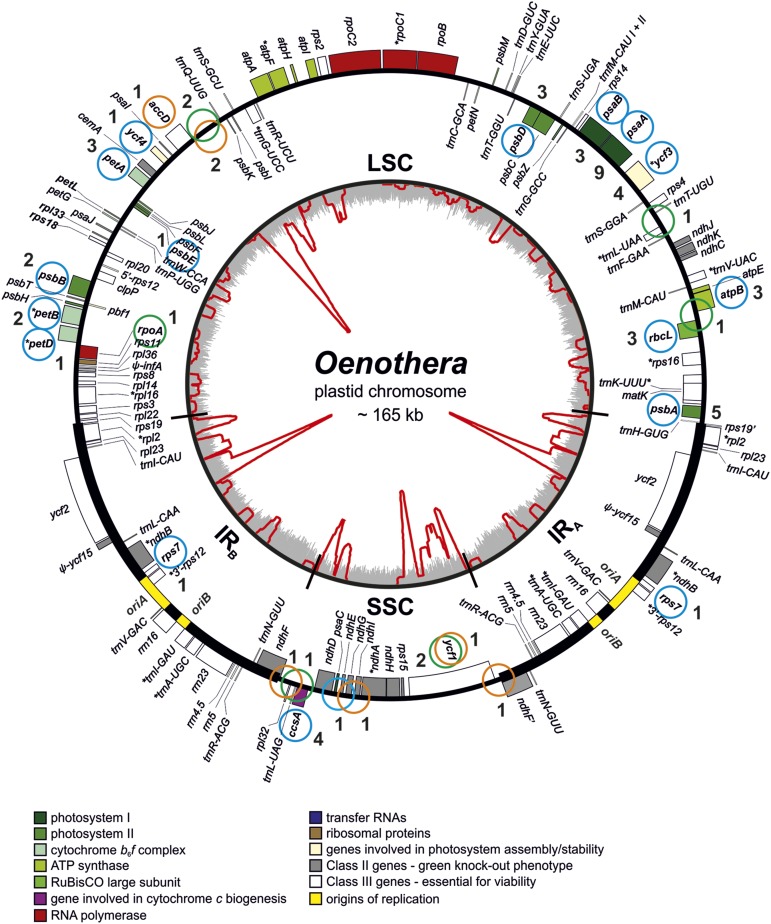
Figure 2.
Distribution of the Mutated Alleles of the Plastome Mutant Collection across the Oenothera Plastome.
The physical map of the plastome is shown, and the origins of replication (oriA and oriB), the GC content (gray inner circle), and the macro repeats (red inner circle) are indicated. Blue circles denote mutations conferring a mutant phenotype; orange circles denote second site mutations which may be phenotypically neutral. Green circles refer to phenotypically neutral mutations in the closely related O. glazioviana and O. elata strains. Note clustering of these mutations in the highly repetitive regions around accD and ycf1 (tic214). Numbers refer to the number of individual mutations identified for a gene or locus. Class I genes are indicated in color and Class II genes and Class III genes in gray or white. For details on the definition of the gene classes, see text. For macro repeat identification, see Greiner et al. (2008a), and for location of the origins of replication, see Chiu and Sears (1992).

