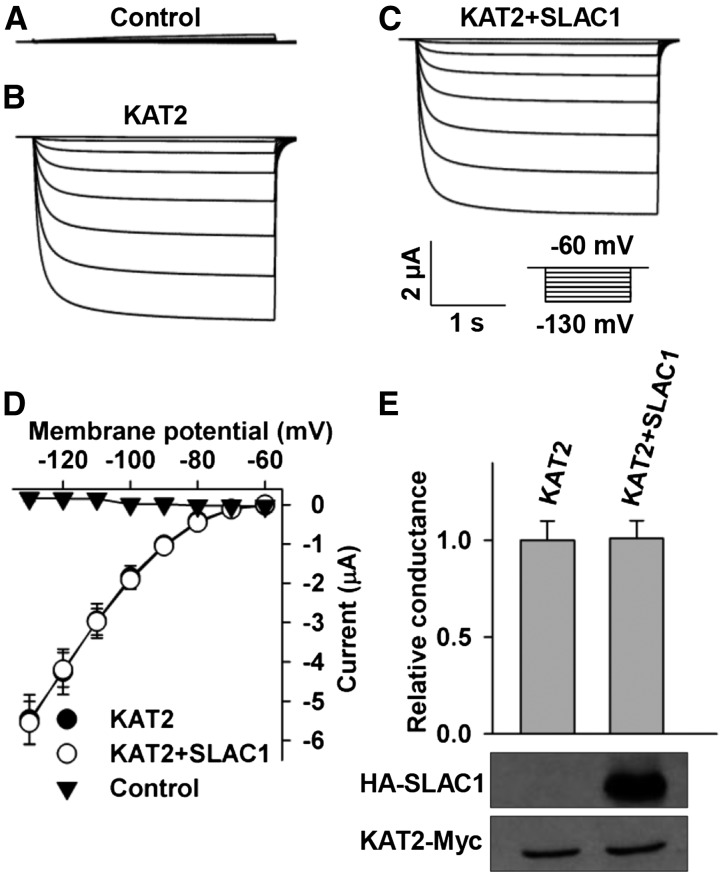
Figure 4.
SLAC1 Does Not Obviously Inhibit KAT2 in X. laevis Oocytes.
(A) to (C) Typical whole-oocyte recordings of negative control oocytes (A), positive control oocytes expressing KAT2 alone (B), and oocytes coexpressing KAT2 and SLAC1 with a [cRNA] ratio of KAT2/SLAC1 of 1:2.
(D) Average current-voltage curves of steady state whole-oocyte currents recorded in oocytes injected with water (n = 4), KAT2 cRNA (n = 6), and a cRNA mixture of KAT2 + SLAC1 (n = 6).
(E) Normalized macroscopic conductance and immunoblot analysis of the oocytes expressing KAT2 with and without SLAC1. The oocyte numbers for K+in recordings in (E) were the same as described for (D). Error bars depict means ± se.

