Figure 6.
Corrected: RNA Binding Specificity of rRAP to Footprint Regions within the 16S Precursor Transcript.
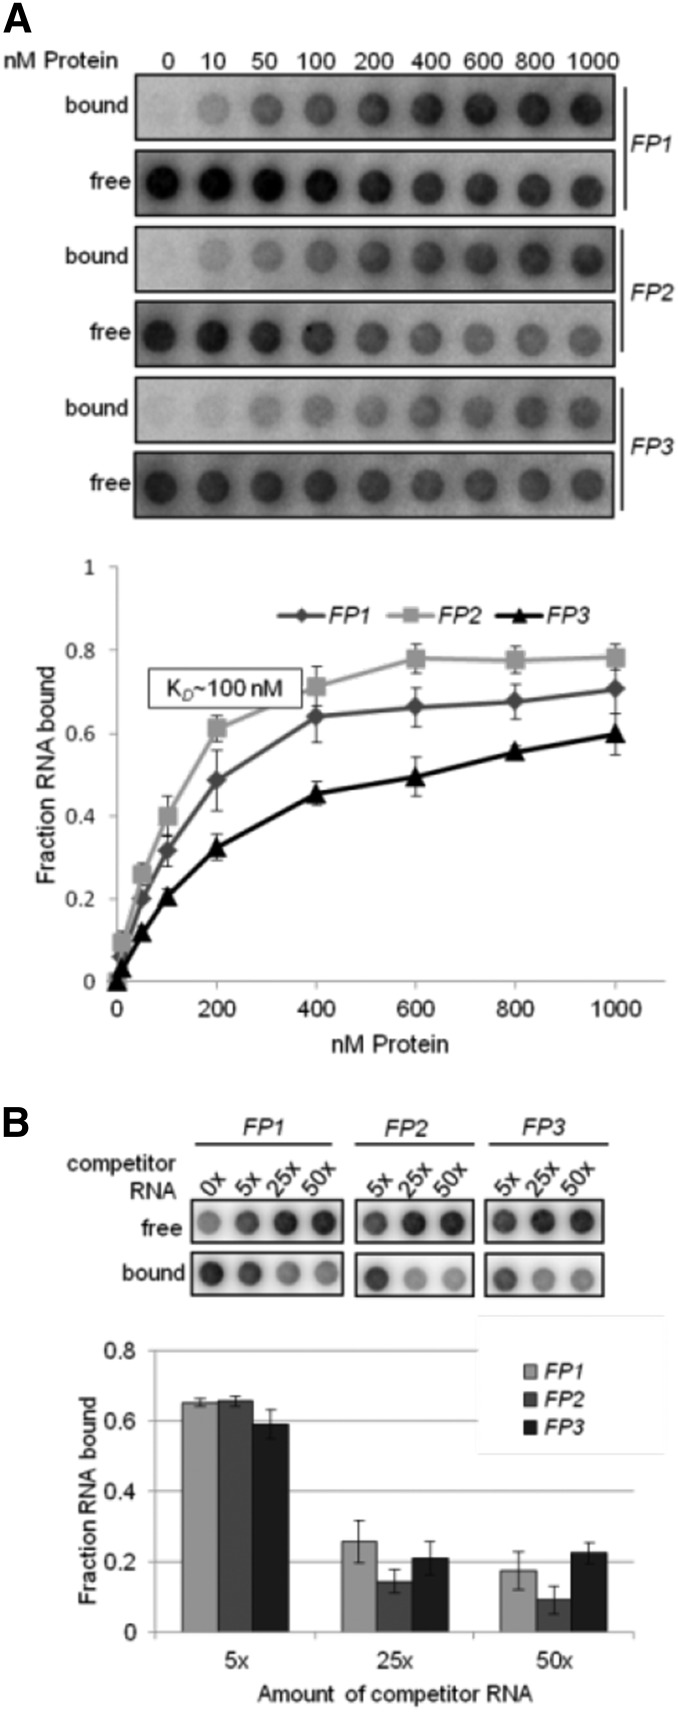
(A) Determination of RNA binding curves. Binding reactions containing 6 pM 32P-labeled RNA of each indicated RNA and increasing molarities of rRAP were filtered through stacked nitrocellulose and nylon membranes using a dot-blot apparatus (top panel). Signal intensities for nitrocellulose-bound protein-RNA complexes (bound) as well as nylon membrane–bound free RNAs (free) were quantified by phosphor imaging. The binding curves were determined from three experiments performed as triplicates (bottom panel). Calculated means are shown with standard deviations indicated by error bars. The equilibrium binding constant (Kd) of rRAP and the FP2 probe was determined to be ∼100 nM as indicated.
(B) Competition experiments. Binding reactions containing rRAP protein, 32P-labeled FP2 RNA, and the indicated molar excess of competitor RNAs representing unlabeled FP1, FP2, and FP3 RNA oligos, respectively, were treated as described in (A). Signal intensities obtained for each reaction without competitor RNA were set to 1. Three independent experiments were performed as triplicates for each reaction, and calculated means are shown with standard deviations indicated by error bars (bottom panel).

