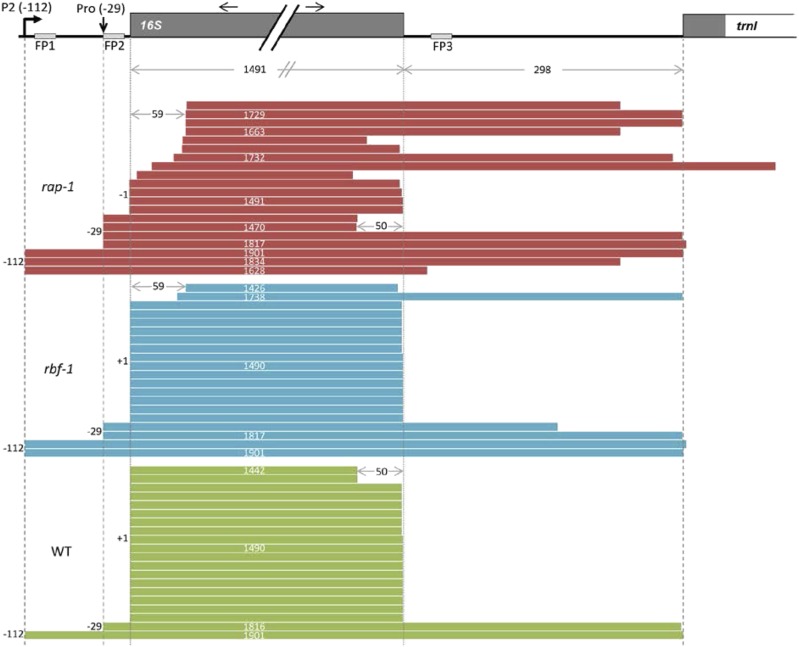
Figure 9.
cRT-PCR.
16S rRNA ends were deduced from cRT-PCR clones (n = 20). Each bar represents a single clone. A schematic representation of a part of the chloroplast rrn operon is shown above the diagram. Dark-gray boxes indicate exons, white boxes introns, and light-gray boxes predicted footprints. The P2 promoter is represented by a bent arrow. The vertical arrow indicates the mapped processing site at −29 with respect to the start of the mature 16S rRNA (previously annotated as “Pro-31” in Bisanz et al., 2003). Black horizontal arrows indicate the positions and directions of the cRT-PCR primer pair.

