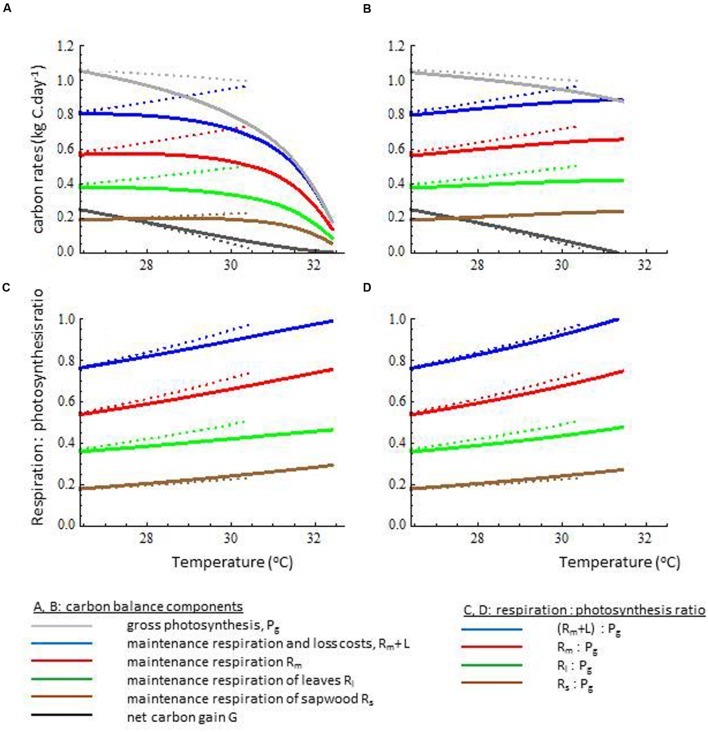
FIGURE 3.
The impact of acclimation on (A,B) the carbon budget components and (C,D) the emergent respiration : photosynthesis ratios. Trees with full acclimation in crown leaf area index, leaf photosynthetic capacity and sapwood area (solid lines in A and C) were compared with trees with acclimation in leaf photosynthetic capacity and sapwood area but with crown leaf area fixed (solid lines in B and D), and with non-acclimation trees having fixed values for crown leaf area index, leaf photosynthetic capacity and sapwood area (dotted lines in all sub-figures). For broader interpretation of simulation results, see Supplementary Figures S3 and S4.

