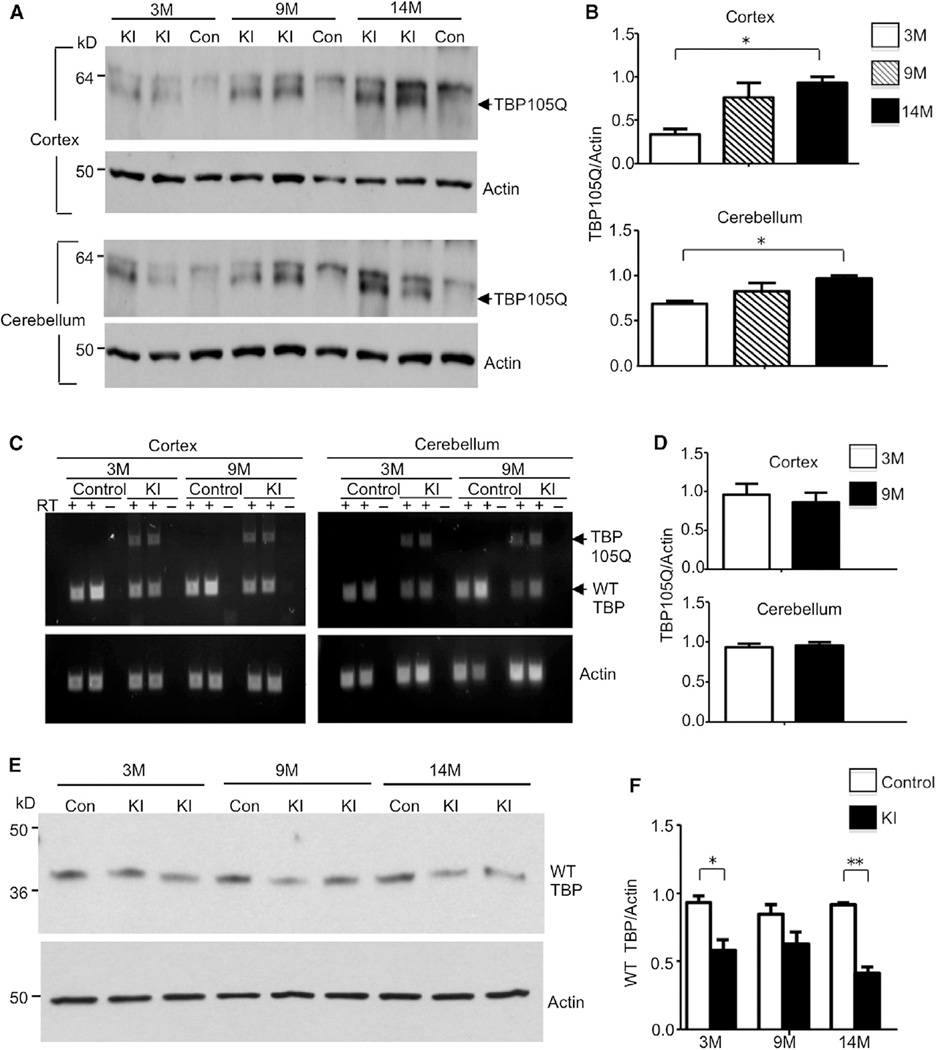
Figure 3. Age-Related Increase of Mutant TBP and Decrease of Wild-Type TBP in TBP105Q Inducible KI Mice.
(A) Western blotting analysis of soluble mutant TBP levels in the cortex and cerebellum of 3-, 9-, and 14-month old TBP105Q inducible KI mice. An age-related increase of soluble mutant TBP (arrow) was observed in KI mice. Control mice (Con) did not show mutant TBP expression. Actin was used as a loading control.
(B) Quantification of the relative amount of TBP (the ratio of TBP to actin) on western blots (*p < 0.05).
(C) RT-PCR revealed similar mRNA levels of mutant TBP in both the cortex and cerebellum of 3- and 9-month-old TBP105Q inducible KI mice. Actin was used as an internal control.
(D) The ratio of mutant TBP to actin transcripts in RT-PCR is quantified.
(E) Western blotting analysis of the expression of mouse endogenous WT TBP in the cerebellum of TBP105Q inducible KI and WT mice at 3, 9, and 14 months of age.
(F) Quantitative analysis of WT TBP level on western blots by measurement of its ratio to actin (*p < 0.05, **p < 0.01). Data are represented as mean ± SEM.

