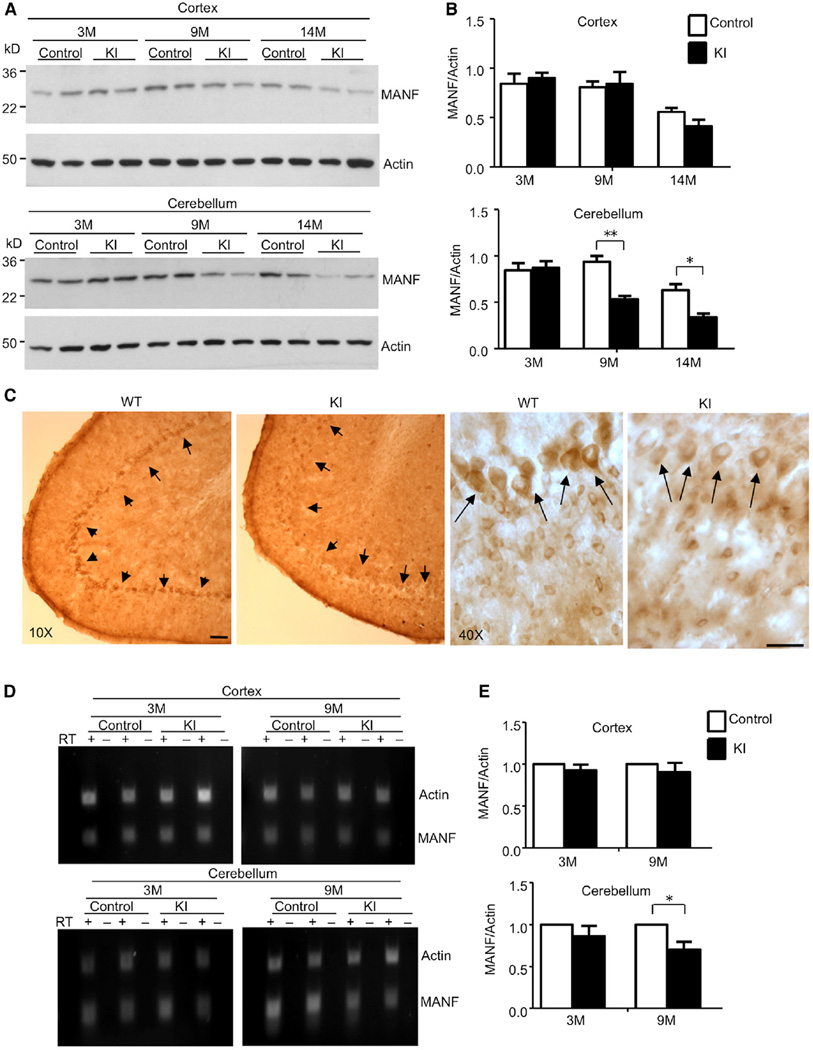
Figure 5. Decreased MANF Level in Purkinje Neurons of TBP105Q Inducible KI Mice.
(A) Western blotting analysis of MANF protein level in the cortex and cerebellum of 3-, 9-, and 14-month-old control and TBP105Q inducible KI mice.
(B) Quantification of the ratio of MANF to actin showing that only the cerebellum in TBP105Q inducible KI mice, starting at 9 months, had a significant decrease of MANF in comparison to the control cerebellum (*p < 0.05, **p < 0.01).
(C) Immunohistochemical study showing the enrichment of MANF in Purkinje neurons of WT cerebellum, and this enrichment is lost in the cerebellum of 14-month-old TBP105Q inducible KI mouse. Scale bars represent 40 µm.
(D) RT-PCR revealed a decrease in MANF mRNA level, which is specific to the cerebellum of KI mice at an old age (9 months). Actin was used as an internal control.
(E) Real-time PCR was used to confirm the RT-PCR result. Relative abundance of MANF was calculated with the value from the control mice set to 1, and actin served as an internal control (*p < 0.05). Data are represented as mean ± SEM.

