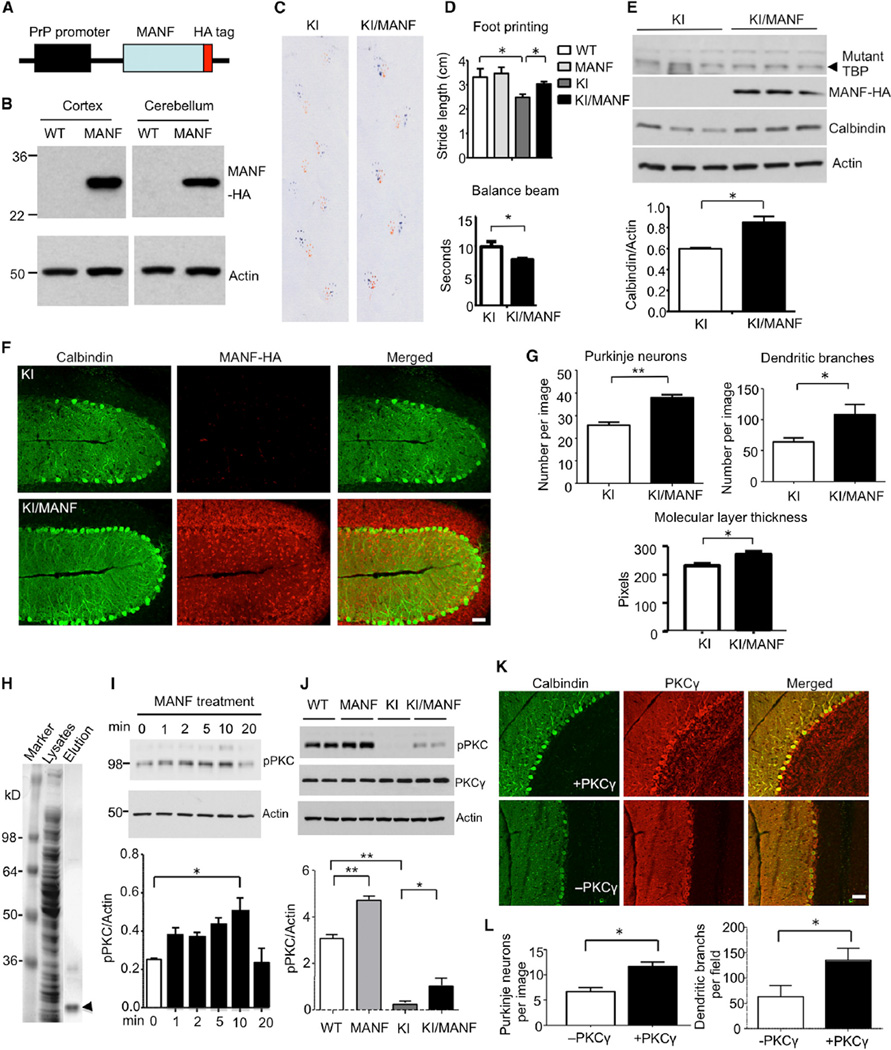
Figure 8. Expression of Transgenic MANF Ameliorates Pathological Phenotypes of SCA17 KI Mice via PKC Phosphorylation.
(A) Schematic map of transgenic MANF construct.
(B) Anti-HA western blotting verified the expression of transgenic MANF-HA in the brain cortex and cerebellum in MANF transgenic mouse.
(C) Gait of SCA17 KI and KI/MANF mice was assessed with foot-printing assay.
(D) KI/MANF mice show longer stride lengths in foot-printing test and shorter walking time in balance beam assay than SCA17 KI mice, indicating an improvement in gait performance and motor coordination (n = 6 each group, *p < 0.05).
(E) Western blotting analysis of mutant TBP labeled by 1C2 antibody, transgenic MANF labeled by anti-HA, and calbindin in the cerebellum of 6-month-old SCA17 KI and KI/MANF mice. Actin was used as a loading control. The ratio of calbindin to actin is presented under the gel data (*p < 0.05).
(F) Immunofluorescent staining images (103 by confocal microscope) of SCA17 KI and KI/MANF mouse cerebellum. Calbindin staining was used to reveal Purkinje neurons, and HA antibody was used to stain transgenic MANF. The scale bar represents 50 µm.
(G) Quantitative assessment of the number of Purkinje neurons labeled by anticalbindin per image field, dendritic branches, and thickness of molecular layer (103, n = 9, *p < 0.05, **p < 0.01).
(H) Coomassie staining of SDS gel containing total bacterial lysates and eluted His-MANF (arrowhead).
(I) The purified His-MANF was applied to PC12 cells, and the PC12 cell lysates were collected 1, 2, 5, 10, and 20 min after MANF treatment and subjected to western blotting with an antibody to phosphor-PKC (pPKC). Actin was used as a loading control. The ratios of pPKC to actin are shown beneath the gel image (*p < 0.05).
(J) Western blotting analysis of pPKC and PKCγ in the cerebellum of mice with different genotypes. The ratios of pPKC to actin are show under the gel image (*p < 0.05, **p < 0.01).
(K) Immunofluorescent staining images of Purkinje neuron of SCA17 KI cerebellum injected with (+) or without (−) PKCγ adenovirus. Calbindin staining was used to reveal Purkinje neurons, and PKCγ antibody was used to detect viral PKCγ. The scale bar represents 50 µm.
(L) Quantitative analysis of the number of Purkinje cells and their branches in KI mice injected with or without viral PKCγ (20×, n = 9, *p < 0.05). Data are represented as mean ± SEM.

