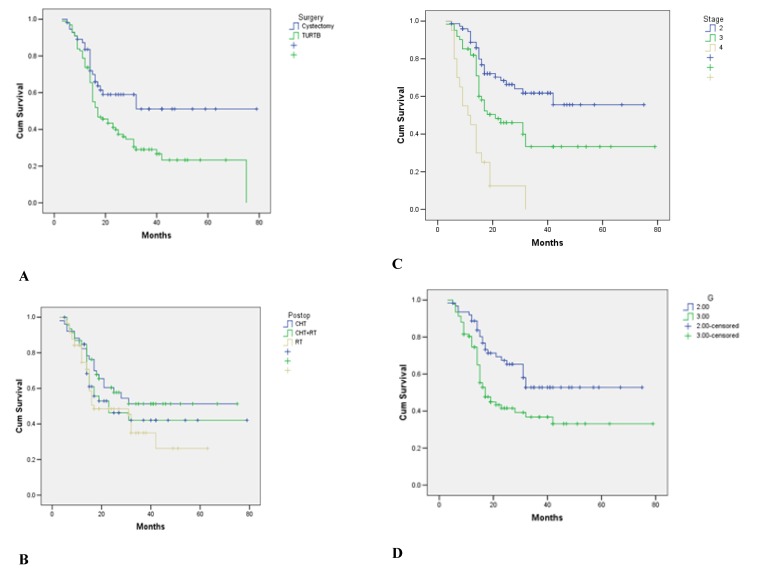
Fig. 2.
A. Analysis of the outcome of patients with stage 2 vs. stages 3 and 4 (HR=0.34; p<0,001; CI 0.086-0.333 and HR=0.29; p<0.001; CI 0.182-0590, respectively). B. Analysis of the outcome of patients with G2 vs. G3 (HR=0.32; p=0.023; CI 0.182-0.959). C. Analysis of the outcome of the patients with cystectomy vs. TURBT (HR=0.61; p=0.019; CI 0.297-0.905). D. Analysis of the outcome of postoperative treatment of patients (radiotherapy vs. chemotherapy vs. chemotherapy + radiotherapy) NS

