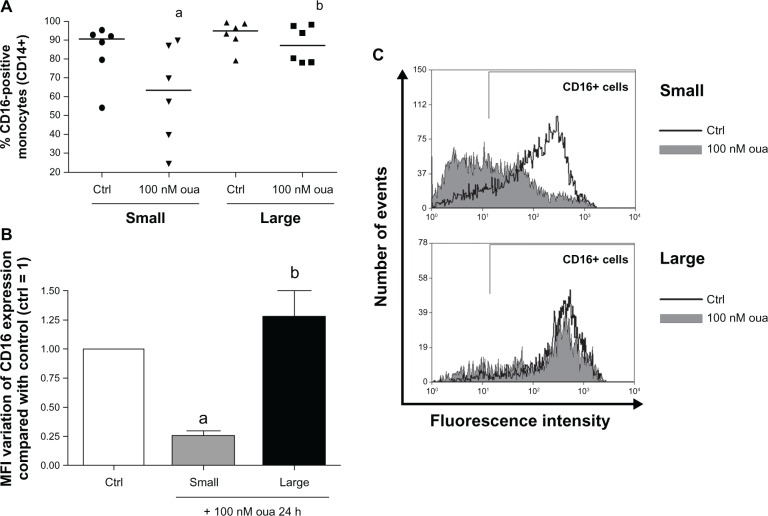
Figure 6.
(A–C) Ouabain (Oua) differentially modulates CD16 expression in small and large monocytes. Monocytes were maintained for adhesion in culture for 2 hours, and CD16 expression was evaluated as described in Figure 4, analyzing small and large subpopulations separately. (A) Medians of CD16-positive cell percentages in small and large monocytes; astatistical difference from control (Ctrl) (P < 0.05, paired t-test); bstatistical difference from small monocytes treated with Oua (P < 0.05, paired t-test). (B) Variation in the means of fluorescence intensities (MFI) of CD16 expression from small and large monocytes incubated with Oua, compared with the Ctrl (set as 1); astatistical difference from Ctrl (P < 0.05, paired t-test); bstatistical difference from small monocytes treated with Oua (P < 0.01, paired t-test). (C) Representative experiment showing CD16 fluorescence histograms obtained by flow cytometry. Black curves indicate control staining, and gray-filled histograms designate treatment with 100 nM Oua for 24 hours in small monocytes (upper panel) and large monocytes (lower panel). These experiments were performed using six individuals.

