
Figure 2.
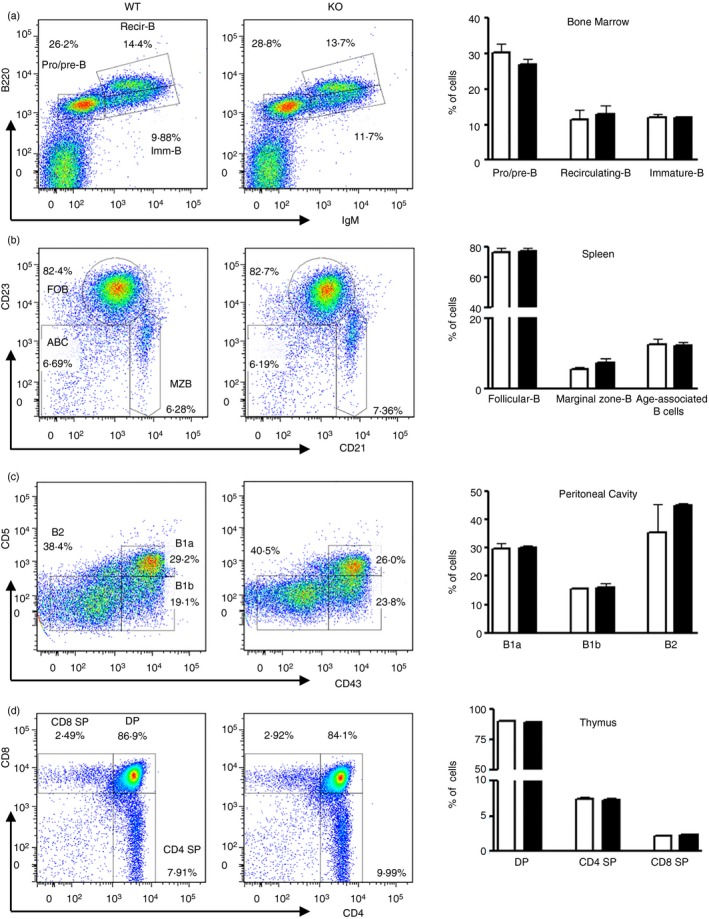
Examination of B‐ and T‐cell populations in wild‐type and miR‐182 knockout (KO) mice. Flow cytometric analyses of B‐cell populations in the bone marrow (a), spleen (b) and peritoneal cavity (c), and T‐cell subsets in the thymus (d) of wild‐type and miR‐182 KO mice. (a) Bone marrow cell suspension was stained for B220 and IgM expression and numbers adjacent to gated areas indicate per cent of total bone marrow cells. (b) Gated splenic CD19+ cells were further interrogated for their expression of CD23 and CD21 to determine populations of CD23+ CD21+ follicular B, CD23− CD21++ marginal zone B, and a mature B‐cell subset termed age‐associated B cells that are CD23− CD21−. Numbers shown are per cent of CD19+ B cells. (c) CD5 and CD43 expression were used to differentiate cell populations in the peritoneal cavity, namely CD5+ CD43+ B‐1a, CD5− CD43+ B‐1b, and CD5− CD43− B‐2 cells. Numbers shown are per cent of CD19+ cells. (d) Thymocytes were stained for CD8 and CD4 expression and numbers adjacent to gated areas indicate per cent of live cells. Frequencies of each subset of cells in wild‐type and miR‐182 KO mice are shown. Data shown represent averages with standard deviations from three independent experiments.