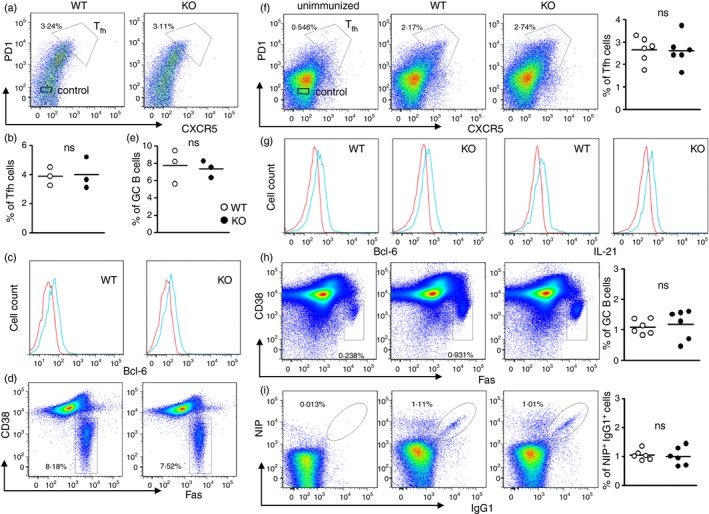
Figure 3.

Analyses of T follicular helper (Tfh) cells and germinal centre (GC) B cells in miR‐182 knockout (KO) mice. (a) Flow cytometric analysis of Tfh cells in the Peyer's patches of unchallenged wild‐type and miR‐182 KO mice. CD4+ TCR β + cells were examined for PD1 and CXCR5 expression and CD4+ TCR β + CXCR5+ PD‐1+ Tfh cells were shown. Numbers indicate per cent of CD4+ TCR β + cells. (b) Tfh cell frequency in wild‐type and miR‐182 KO mice. (c) Histogram profile of Bcl‐6 expression in Tfh cells (blue histogram) and non‐Tfh cells (red histogram). (d) Flow cytometric analyses of the Peyer's patches of wild‐type and miR‐182 KO mice depicting activated B‐cell populations (B220+ Fas+ CD38−), and numbers indicate per cent of total Peyer's patches cells. Numbers indicate per cent of B220+ cells. (e) Frequency of GC B cells in wild‐type and miR‐182 KO mice (on the same panel as B). (f) Wild‐type and miR‐182 KO mice were analysed 10 days after challenge with NP 38‐CGG. Flow cytometry analysis and quantification of the percentage of Tfh cells in the spleens of immunized wild‐type and miR‐182 KO mice. Numbers shown are per cent of CD4+ TCR β + cells. (g) Histogram profile of Bcl‐6 and interleukin‐21 (IL‐21) expression in Tfh cells (blue histogram) and non‐Tfh cells (red histogram). (h) Flow cytometry analysis and quantification of the percentage of B220+ Fas+ CD38− GC B cells in the spleens of immunized wild‐type and miR‐182 KO mice. Numbers shown are per cent of B220+ cells. (i) FACS analysis of antigen‐specific NIP + IgG1+ B cells from B220+Dump− cells in the spleens of immunized wild‐type and miR‐182 KO mice. Numbers shown are per cent of antigen‐specific NIP + IgG1+ B cells from the B220+ Dump− gate. Frequencies of antigen‐specific NIP + IgG1+ B cells in immunized wild‐type and miR‐182 KO spleens.
