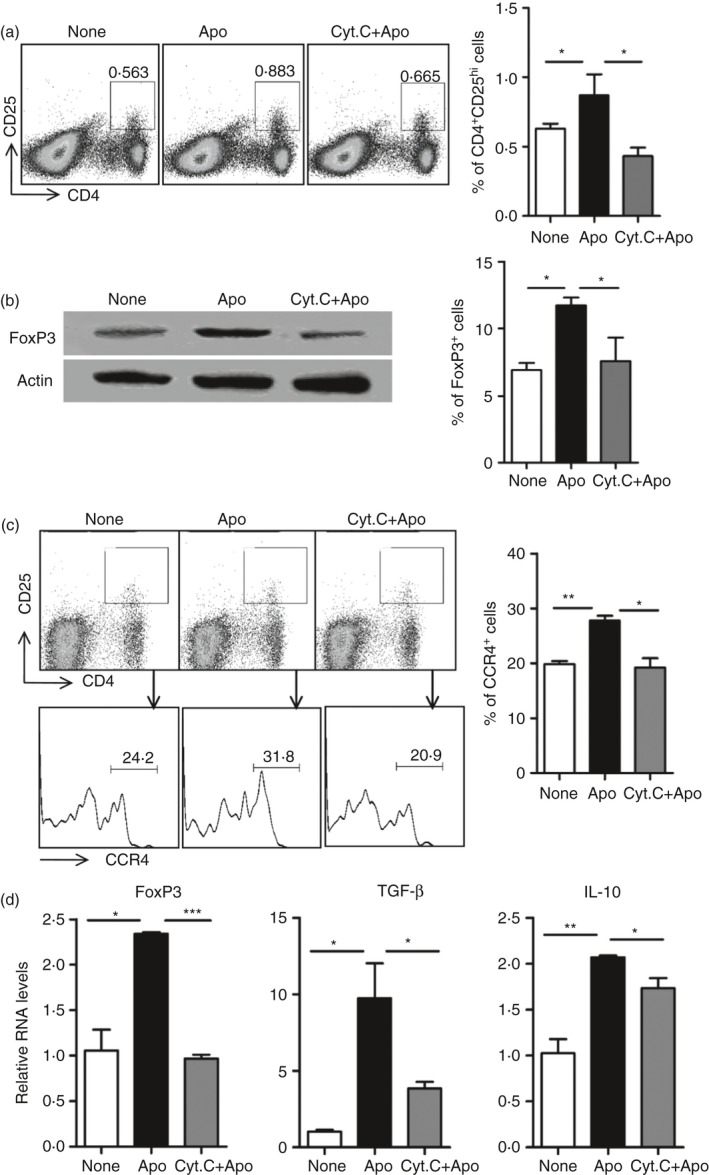
Figure 5.

Failure to increase CCR4+ regulatory T (Treg) cell percentage by apoptotic cell challenge in spleen with deletion of CD8α + CD103+ dendritic cells (DCs). (a) Splenocytes from mice described as in Fig. 2(c) were stained with antibodies for CD4 and CD25 and the percentage of CD4+ CD25hi were analysed by FACS. (b) Splenic CD4+ T cells enriched from mice described as in Fig. 2(c) were used for detection of FoxP3 protein expression using Western blotting analysis detection directly (left panel). Percentage of the FoxP3+ cells in CD4+ T cells was also compared using FACS analysis (right panel). (c) Splenocytes were further stained with antibodies for CD4, CD25 and CCR4, and the percentage of CCR4 in CD4+ CD25hi was analysed by FACS. (d) Splenic CD4+ T cells enriched from mice described as in Fig. 2(c) were investigated using quantitative PCR analysis of mRNA expression levels of FoxP3, transforming growth factor‐β (TGF‐β) and interleukin‐10 (IL‐10). *P < 0·05, **P < 0·01, ***P < 0·001 compared with control, respectively.
