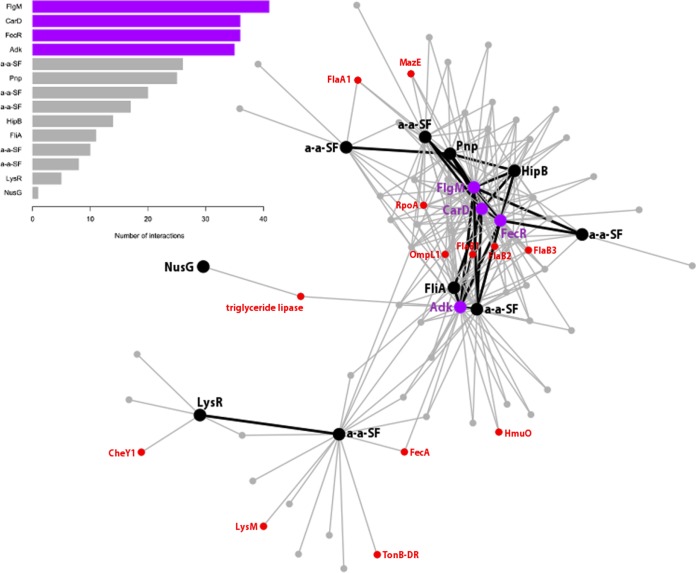
FIG 3 .
Major coexpression network. The figure shows the biggest coexpression network (network 1 in Fig. 2). The bar graph shows all regulatory genes in the network sorted by the number of interactions (coexpressed genes). The top 4 regulatory genes are highlighted in purple, while the rest are highlighted in black. Other relevant genes that are discussed in the text are in red. Black lines represent coexpression between regulatory genes.

