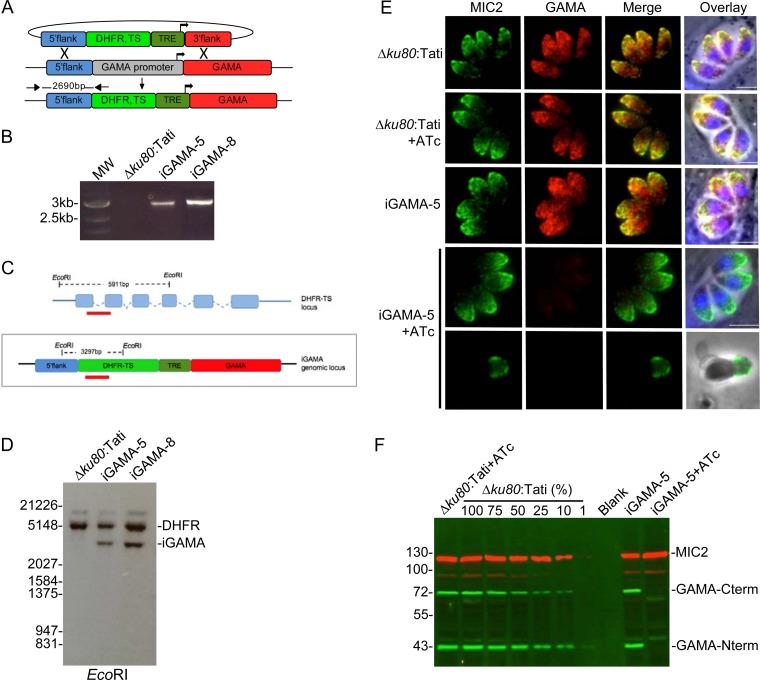
FIG 4 .
Establishment of a TgGAMA conditional-knockdown strain. (A) Schematic strategy used to generate iGAMA by replacement of the endogenous promoter with TRE and a truncated SAG4 promoter by double homologous recombination. (B) PCR assay confirming integration of the DHFR-TS selectable marker and TRE-SAG4 (T7S4) cassette at the GAMA gene locus. The primers used are indicated in panel A. MW, molecular weight. (C) Schematic showing EcoRI restriction sites in the endogenous DHFR-TS locus and the iGAMA locus used for Southern blot analysis. Predicted fragments for the endogenous DHFR locus and the iGAMA locus are shown. Annealing sites for the probe are indicated by red bars. (D) Southern blot analysis of iGAMA clones demonstrates that the T7S4 cassette was integrated as a single copy into the genome. Bands from the endogenous DHFR-TS locus and the iGAMA locus are indicated. Values on the left indicate molecular weight in base pairs. (E) Immunofluorescence imaging shows downregulation of TgGAMA following 24 h of treatment with ATc, indicated by the absence of microneme staining with rabbit anti-GAMA antibody. ATc has no effect on TgGAMA expression in Δku80:Tati parental tachyzoites. The bottom row shows lack of surface staining for an invading iGAMA parasite after ATc treatment, further confirming the specificity of the antibody. Bars, 5 µm. (F) Infrared fluorescence Western blot assay including a standard curve of parental parasite lysates from 100% to 1% shows that the level of TgGAMA expression (green bands) in iGAMA tachyzoites is similar to that in WT parasites and that TgGAMA expression is reduced to less than 1% of the WT level after 48 h of ATc treatment. Staining for MIC2 (red bands) was included as a loading control. Values on the left indicate molecular mass in kilodaltons.

