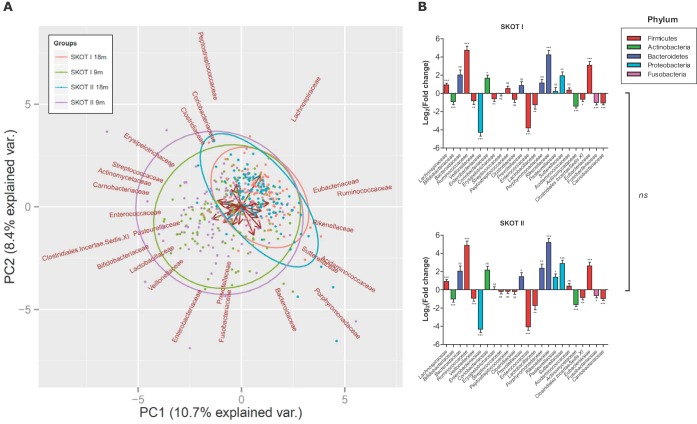
FIG 3 .
Gut microbiota composition is independent of maternal obesity but changes over time. (A) PCA biplot of the relative abundances of bacterial families at 9 and 18 months of age in SKOT I and SKOT II. Ellipses indicate 95% confidence intervals for each group, while arrows show loadings. var., variance. (B) Log2-transformed fold changes of relative abundances of bacterial families between the ages of 9 and 18 months within SKOT I and SKOT II. Error bars indicate the standard error of the mean. ns, not significant; *, q < 0.05; **, q < 0.01; ***, q < 0.001 (according to false-discovery-rate-corrected [5%] paired Wilcoxon signed-rank tests of relative abundances at 9 months versus 18 months). No significant differences were found between the fold changes of bacterial families occurring in the two cohorts after we performed false-discovery-rate-corrected (5%) Mann-Whitney tests.

