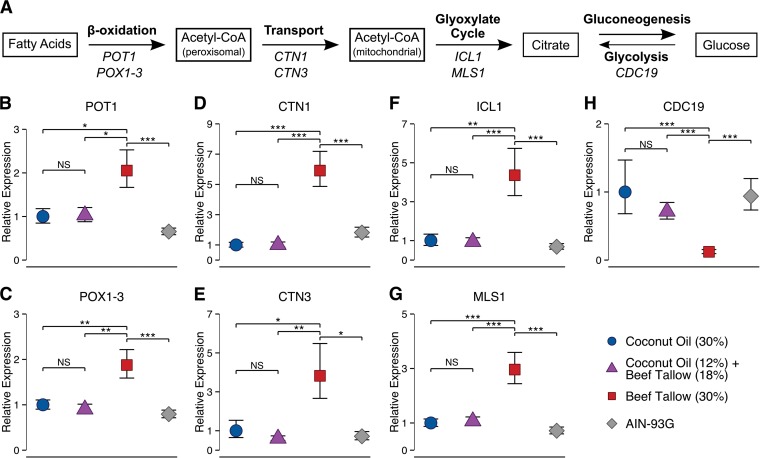
FIG 8 .
Expression of C. albicans fatty acid catabolic genes is lower in the cecal contents of coconut oil-fed mice than in the cecal contents of beef tallow-fed mice. (A) Schematic of fatty acid catabolism in C. albicans. The pathways of fatty acid β-oxidation, acetyl-CoA transport (carnitine shuttle), the glyoxylate cycle, gluconeogenesis, and glycolysis are depicted, and the names of C. albicans genes differentially regulated in response to experimental diets are shown. (B to H) The expression of C. albicans genes was measured in the cecal contents of mice fed a high-fat diet containing either coconut oil or beef tallow (30%) or both (12% coconut oil and 18% beef tallow) or a standard diet (AIN-93G). (B to G) Expression of the fatty acid β-oxidation genes POT1 (B) and POX1-3 (C), the carnitine acetyltransferase genes CTN1 (D) and CTN3 (E), and the glyoxylate cycle genes ICL1 (F) and MLS1 (G) was lower in C. albicans from mice fed the coconut oil diet or the diet containing both beef tallow and coconut oil than in C. albicans from mice fed the beef tallow diet. (H) Expression of the glycolytic gene CDC19 was higher in C. albicans from mice fed the coconut oil diet or the diet containing both beef tallow and coconut oil than in C. albicans from mice fed the beef tallow diet. Data are expressed as fold change relative to the mean expression in mice fed the coconut oil diet; all gene expression data (measured via RT-qPCR) have been normalized to reference genes. Symbols indicate means ± standard errors; n = 8 to 12 mice per diet. NS, P > 0.05; *, P < 0.05; **, P < 0.01; ***, P < 0.001, Bonferroni-corrected pairwise t test following one-way ANOVA.

