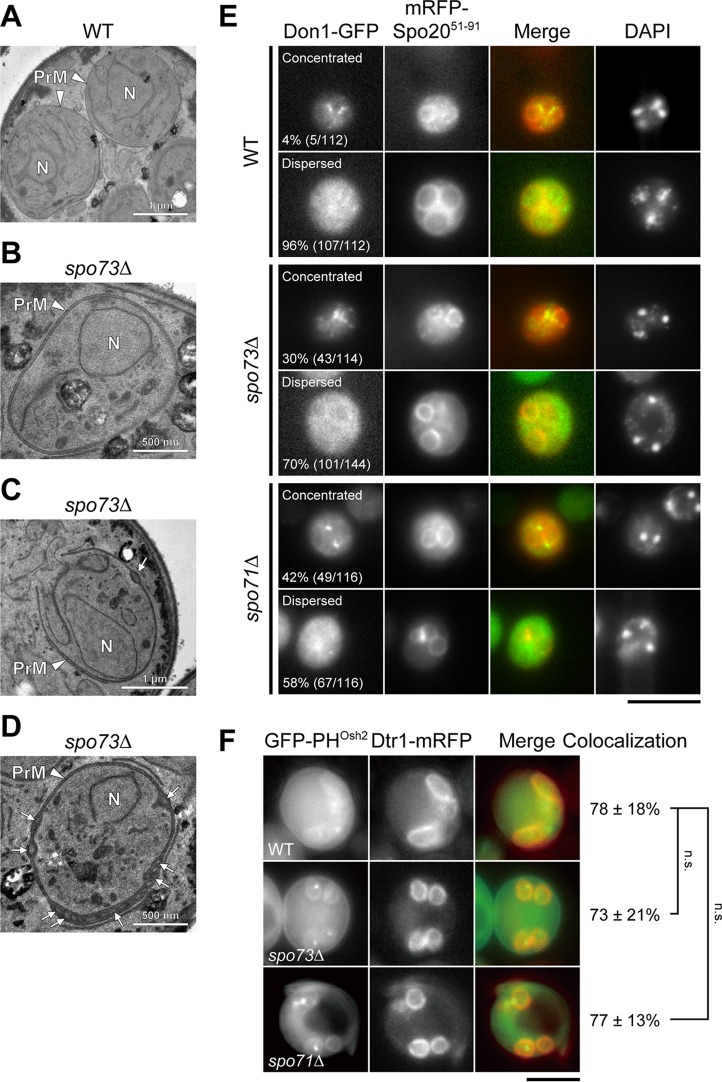
FIG 3.
Phenotypic analysis of spo73∆ mutant. (A to D) AN120 (wild-type [WT], A) and TC545 (spo73∆ mutant, B to D) cells were sporulated for 7.5 h and subjected to EM analysis. Prospore membranes and intraluminal vesicles are indicated by arrowheads and arrows, respectively. N, nucleus; PrM, prospore membrane. A scale bar is shown in each panel. (E) YUY088 (DON1-GFP), YUY090(DON1-GFP spo73∆), and YUY089 (DON1-GFP spo71∆) cells expressing mRFP-SPO2051-91 were sporulated for 9 to 11 h to analyze postmeiotic cells selected with DAPI staining. Representative cells are shown. Upper panels for each strain show cells in which Don1 was concentrated on the prospore membrane. Lower panels for each strain show cells in which Don1 was dispersed in the cytoplasm localization after removal from the leading edge. Scale bar, 5 µm. The percentage of cells showing each pattern is shown. More than 100 prospore membranes were examined for each strain. (F) AN120 (wild-type), TC545 (spo73∆ mutant), and TC581 (spo71∆ mutant) cells expressing DTR1-mRFP and GFP-PHOSH2 were sporulated for 7.5 to 9 h and observed. Representative cells are shown. Scale bar, 5 µm. The average percentage of GFP-PHOSH2-positive prospore membranes in Dtr1-mRFP-positive prospore membranes is shown with the standard deviation. More than 50 prospore membranes were scored in three separate experiments. n.s., not significant (Dunnett’s test).

