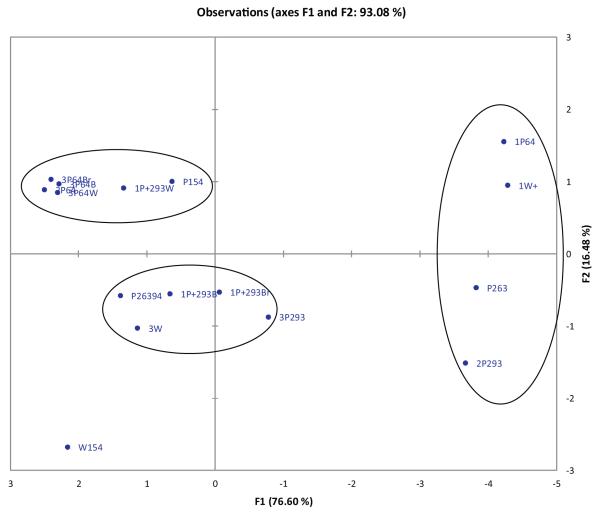
Fig. 6.
Principal component analysis of the content of silymarin components in Silybum marianum samples growing in Egypt. Plot of the observations in the space of F1 and F2 representing 93.08% of variability. Fruit sample codes correspond to those in Table 1.

