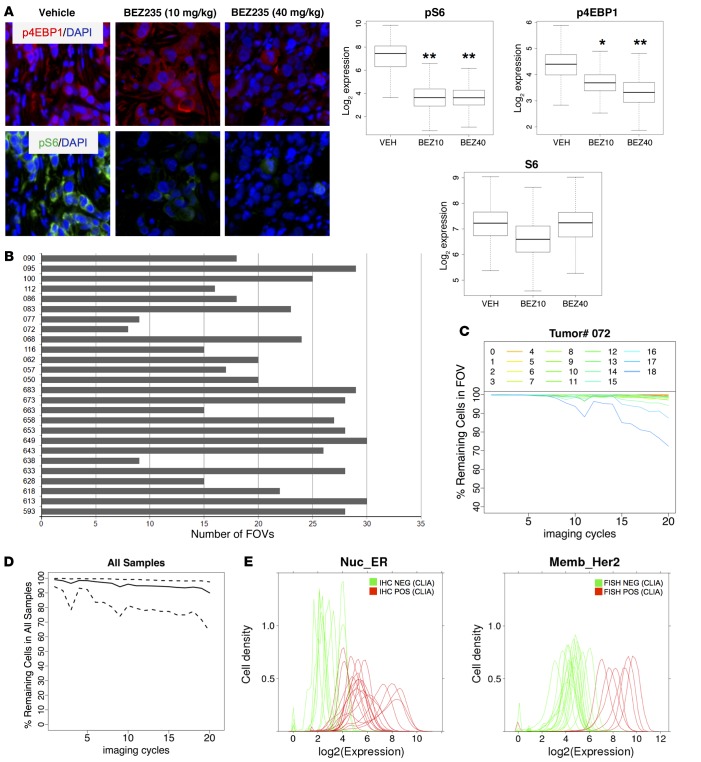
Figure 2. Validation of staining approach.
(A) Quantification of phosphoepitopes. Nude mice (n = 3 per group) harboring subcutaneous BT-474 human breast cancer xenografts were treated with a single dose of the dual PI3K/mTOR kinase inhibitor NVP-BEZ235 (10 mg/kg or 40 mg/kg) or vehicle. Tumors were collected 3 hours later, routinely processed, and stained with our multiplexed immunofluorescence method. Top: representative immunofluorescence images from one tumor per cohort, p4EBP1 = red; pS6 = green; DAPI = blue. Bottom: quantification of staining results. *P < 0.05, **P < 0.01, t test, comparing each treatment group to the control group. Original magnification: ×20, zoom ×6. (B) Number of field of views (FOVs) examined for each tumor. Only FOVs with more than 90% IDC cells were included. (C) Tissue loss during successive imaging cycles shown for one representative tumor sample (tumor 072). The y axis depicts the fraction of tumor cells that remain attached to the slide in each FOV (FOVs 1–18) during each imaging cycle and can be coregistered through all cycles. Each line graph represents one FOV. (D) Tissue loss during successive imaging cycles shown for all 26 breast cancer samples. The y axis depicts the fraction of remaining cells (solid line) with a 95% confidence interval (between quantile 2.5% and 97.5%). 638,577 IDC cells that could be coregistered throughout all staining cycles were included in the subsequent proteomic analysis. (E) Correlation of multiplexed immunofluorescence staining results with clinical laboratory improvement amendments (CLIA) assays for estrogen receptor (ER) (left) and HER2 (right) from the same tumor. ER was determined by IHC, HER2 was determined by FISH. Green represents samples that were negative in the CLIA assay, and red represents samples that were positive in the CLIA assay. The cut-off for the ER CLIA assay was 1% of cells staining positive for ER. The cut-off used for CLIA HER2 FISH amplification was a HER2/CEP17 gene copy number ratio of 2.0 or greater.

