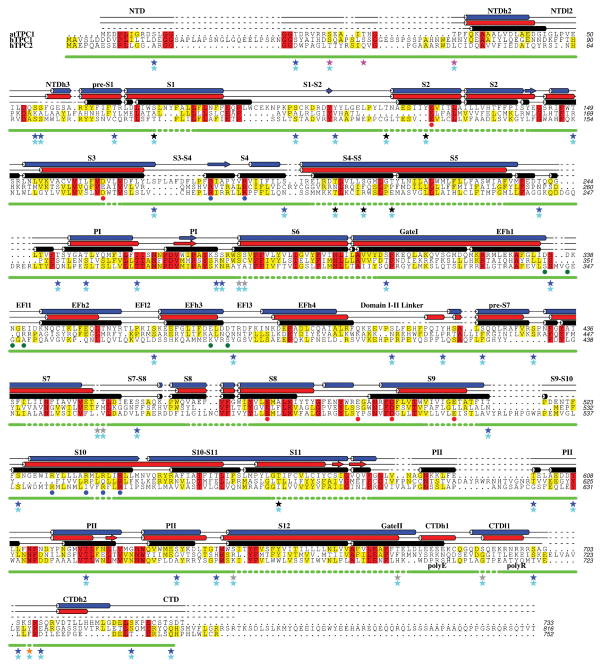
Extended Data Figure 1. Sequence alignment of TPCs with TPC1 experimental and predicted secondary structure.
A sequence alignment based on seven human and plant TPC orthologs with observed TPC1 (black) and secondary structure predictions by Psipred48 (red) and Jpred49 (blue). Helices are shown as cylinders, beta sheets as planks, coil as solid lines, and unstructured regions as dashed lines. Level of conservation is indicated by color (>50% yellow; >80% red). Blue dots (
 ) mark arginines in S4. Red dots (
 ) mark charge-transfer anions. Green dots (
 ) mark Ca2+-binding sites in the EF-hand. Solid and dashed green lines represent observed and absent peptides from mass spectrometry experiments. Magenta stars (
 ), orange stars (
 ), cyan stars (
 ), blue stars (
 ), black stars (★), and grey stars (
 ) mark observed phosphorylation sites using ESI-MS (Extended Data Fig. 3a), potential phosphorylation sites identified by truncation constructs (Extended Data Fig. 3e), predicted phosphorylation sites by NetPhosK50, non-phosphorylated sites, unlikely sites due to solvent inaccessibility, and mark unknown or unidentified regions, respectively.

