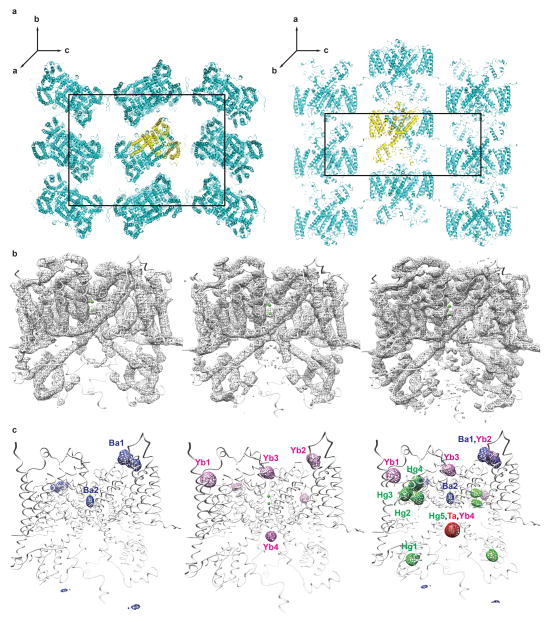
Extended Data Figure 2. Crystal packing of TPC1 and experimental electron densities.
a, Views of the TPC1 C2221 crystal lattice viewed along 2-fold axes parallel to a (left) and b (right). Unit cell boundaries are shown. The asymmetric unit is shown in yellow. b, Transverse view of TPC1 is shown with overlayed FOM-weighted experimental electron density calculated using native amplitudes (Native 1) and heavy-atom phases contoured at 1 σ. (left to right) Density modified phases from non-dehydrated derivatives (Extended Data Table 1), dehydrated derivatives (Extended Data Table 2), and combined phases with solvent flattening, histogram matching, phase extension to high resolution native (Native 2), and cross-crystal averaging (See Methods, Extended Data Table 3). c, Transverse views of TPC1 with overlayed heavy atom electron densities calculated from isomorphous differences.

