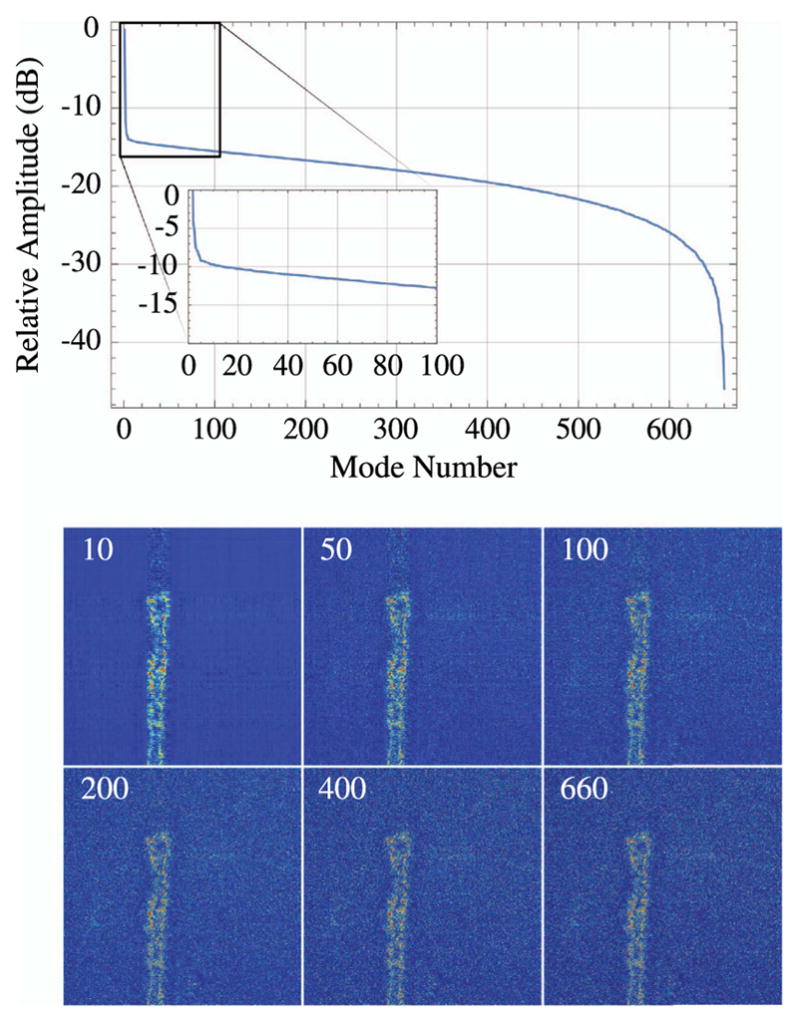
Figure 59.

Noise reduction by singular value decomposition. The uppermost plot displays the normalized amplitude of the SVD modes for a single frame of the SHG image shown in Fig. 58 The inset is a zoom in of the first 100-mode amplitudes. All other images are reconstructions with the number of retained modes indicated by the number in the upper left corner. Note that, for the final image with 660 modes, equivalent to the number of pixels per side, the reconstructed image is identical to that of the measured image.
