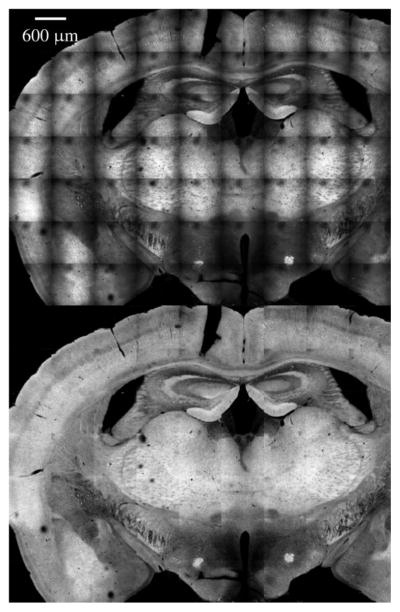
Figure 61.
FOV efficiency correction in mosaic imaging of fixed murine cortical tissue labeled with YFP. The upper panel shows images that have not been corrected for the nonuniform FOV efficiency, which is evident in the repetitive pattern seen in each panel, despite the changing morphology. The lower image shows the image corrected for FOV efficiency. The FOV efficiency map was computed by taking the median value of each pixel from the set of mosaic panels.

