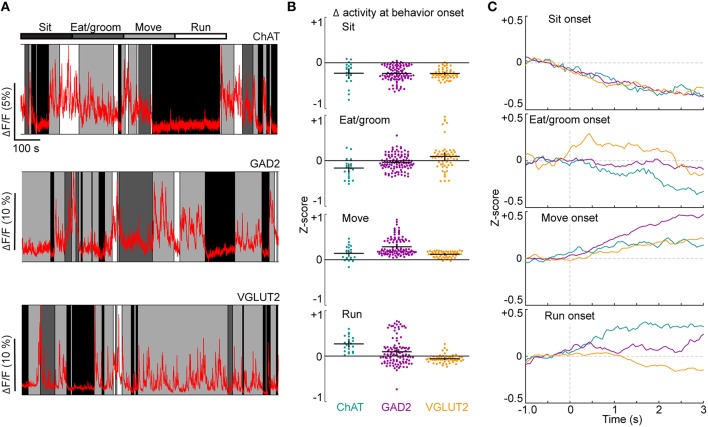
Figure 2.
Imaging neuronal activity during spontaneous behaviors. (A) Examples of neuronal activity in ChAT-, GAD2-, and VGLUT2-Cre mice. Behaviors (sitting, eating/grooming, moving or running) are indicated by shading. (B) Changes in activity in individual ROIs at the onset of each behavior. Black crosses signify mean ± SEM. Fgenotype = 4.5, p = 0.01; Fbehavior = 102.7, p < 0.01; Finteraction = 16.3, p < 0.01, 2-way ANOVA, n = 22 ChAT, 108 GAD2, 58 VGLUT2 cells. See also Movie S1. (C) Mean activity of all ROIs from each cell type, aligned by behavior onset.

