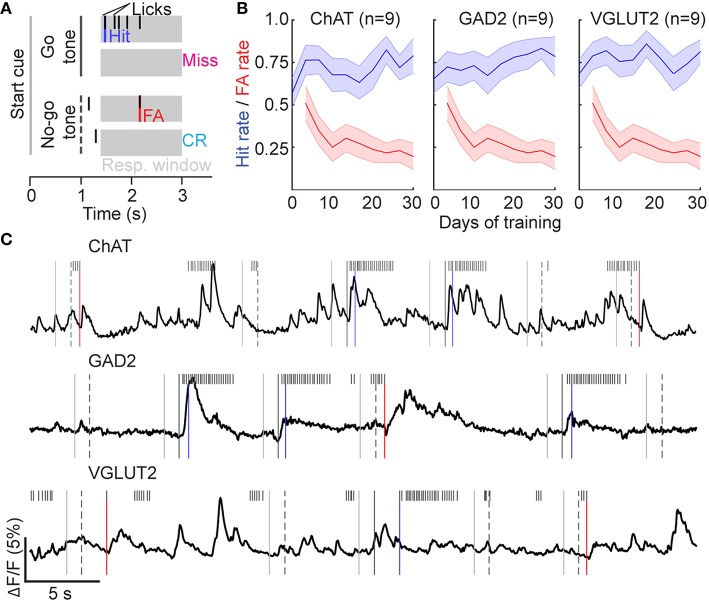
Figure 3.
Go/no-go auditory discrimination task. (A) Illustration of task structure. (B) Hit and False Alarm rates during 3 days of conditioning (Go tone only) followed by 27 days of performing the discrimination task. Line and shading, mean ± SEM for all mice of each genotype. (C) Examples of neuronal activity in ChAT-, GAD2-, and VGLUT2-Cre mice performing the discrimination task. Task events are denoted as in (A).

