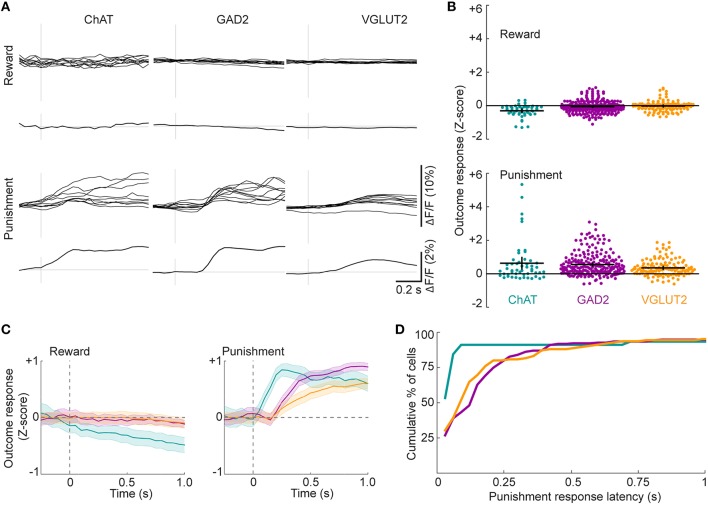
Figure 6.
Reward- and punishment-related neuronal activity. (A) Examples of single-trial neuronal activity aligned to either reward or punishment. Mean response across all trials of each type is shown below the single-trial traces of each cell. (B) Changes in ΔF/F (Z-score) of individual ROIs at the time of reward (top) or punishment (bottom). Black crosses signify mean ± SEM. Fgenotype = 2.26, p = 0.10; Fevent = 184.16, p < 0.01; Finteraction = 9.68, p < 0.01, 2-way ANOVA, n = 51 ChAT, 242 GAD2, 130 VGLUT2 cells. (C) ΔF/F (Z-score) at the time of reward (top) or punishment (bottom) averaged across all ROIs from each cell type. Shading, ± SEM. (D) Distributions of response latencies for the three cell types after air puff delivery during the go/no-go task.

