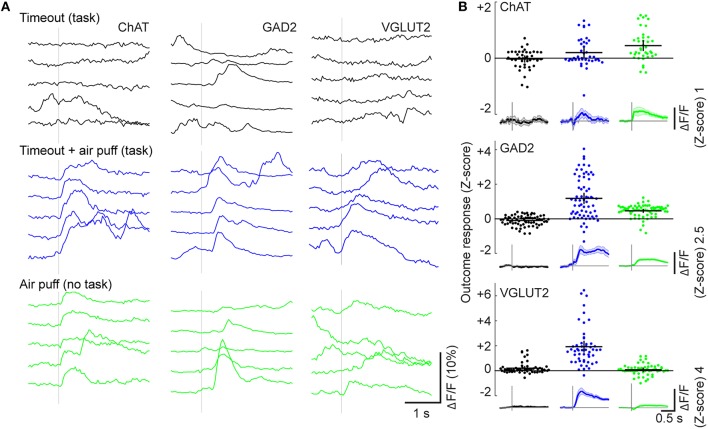
Figure 7.
Dependence of activity on overt punishment and behavioral contingency. (A) Responses to timeout-only punishment during the task (black, top), timeout and air puff during the task (blue, middle), or random air puff outside of the task (green, bottom). Each panel shows calcium traces from five consecutive trials from an example neuron. (B) Changes in ΔF/F (Z-score) in individual ROIs evoked by each form of punishment (color-coded). Black crosses, mean ± SEM. Insets below: ΔF/F traces averaged across all ROIs of each cell type for each form of punishment; Shading, ± SEM.

