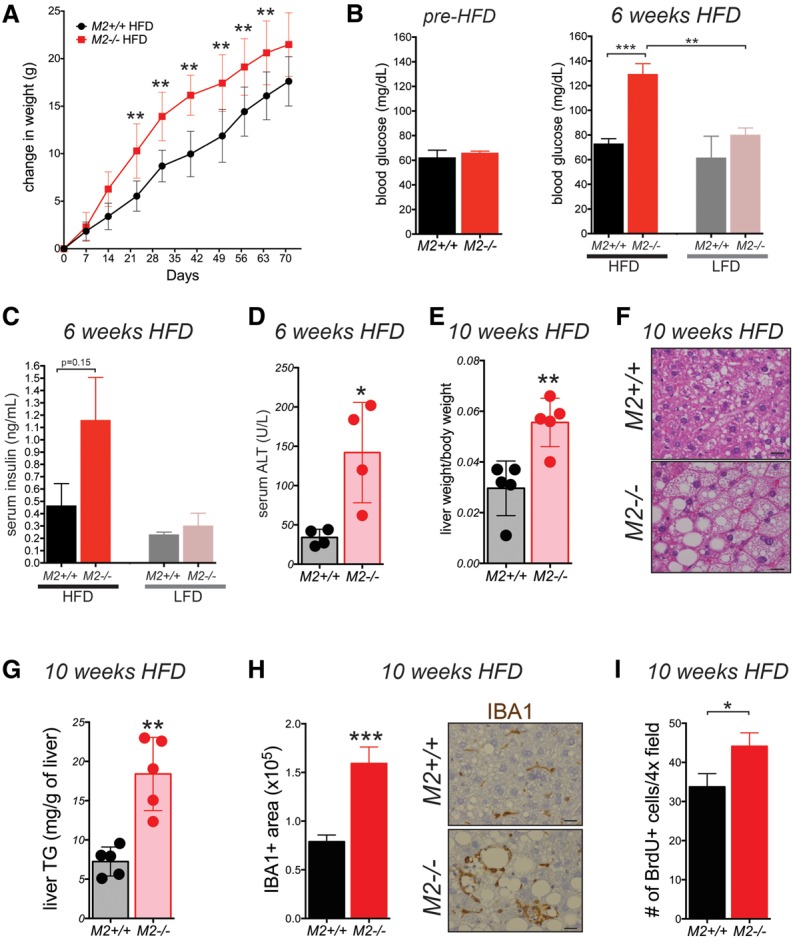
Figure 5.

PKM2-null mice are sensitive to HFD-induced metabolic distress. (A) Weekly weight measurements of 8- to 12-wk-old M2+/+ and M2−/− male mice fed a HFD. Blood glucose (B) and serum insulin (C) were measured in fasted (16 h) M2+/+ or M2−/− mice fed a HFD or LFD for 6 wk. (B) The fasting glucose levels of mice before being placed on either diet are shown at the left. (D) Levels of ALT were measured in serum of M2+/+ or M2−/− mice after 6 wk on a HFD. (E) Ratio of liver weight to body weight of mice fed a HFD at the end of the 10-wk regimen. (F) Representative H&E images of livers from M2+/+ and M2−/− male mice after a 10-wk HFD regimen. Bars, 20 μm. (G) Triglyceride (TG) concentrations were measured in the livers of fed M2+/+ or M2−/− mice after 10 wk on a HFD. (H) Quantification of Iba1+ macrophages in livers from M2+/+ or M2−/− mice fed a HFD for 10 wk. Representative images of the IHC for Iba1 are shown. Bars, 20 μm. (I) Quantification of BrdU-positive cells in livers from M2+/+ or M2−/− mice fed a HFD for 10 wk. Means ± SEM and P-values using unpaired t-test are shown. (*) P < 0.05; (**) P < 0.01; (***) P < 0.001.
