Figure 3.
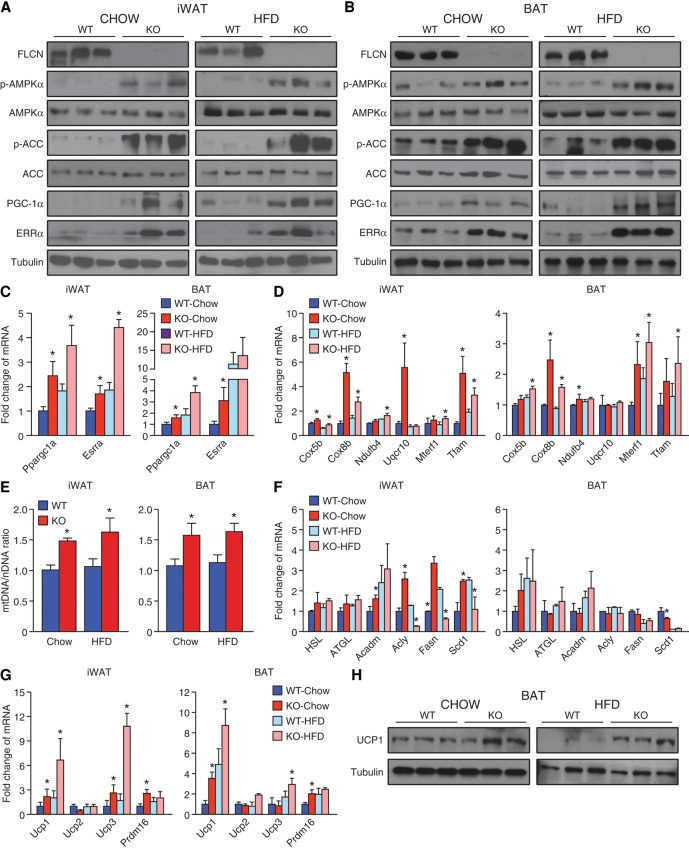
FLCN repression up-regulates an AMPK/PGC-1α/ERRα molecular axis, promoting metabolic reprogramming and WAT browning. (A,B) Western blot analysis performed with the indicated antibodies on iWAT (A) and BAT (B) of 4-mo-old mice fed either chow or a HFD. Relative expression of mRNA transcripts encoding PGC-1α (Ppargc1a) and ERRα (Esrra) (C) as well as mRNA levels of mitochondrial associated genes (D) in iWAT and BAT of wild-type and Adipoq-FLCN knockout mice are shown. (E) Adipose tissue mitochondrial content was determined by the ratio of mtDNA:nDNA. Quantitative RT–PCR (qRT–PCR) analysis of genes related to lipid metabolism (F) and thermogenesis (G) in iWAT and BAT of wild-type and Adipoq-FLCN knockout mice. (H) UCP1 protein levels in BAT of wild-type and Adipoq-FLCN-null mice fed chow or a HFD. Tubulin levels are shown as a loading control. Data in C–G are presented as mean ± SEM. n = 8–10 mice per group. (*) P < 0.05.

