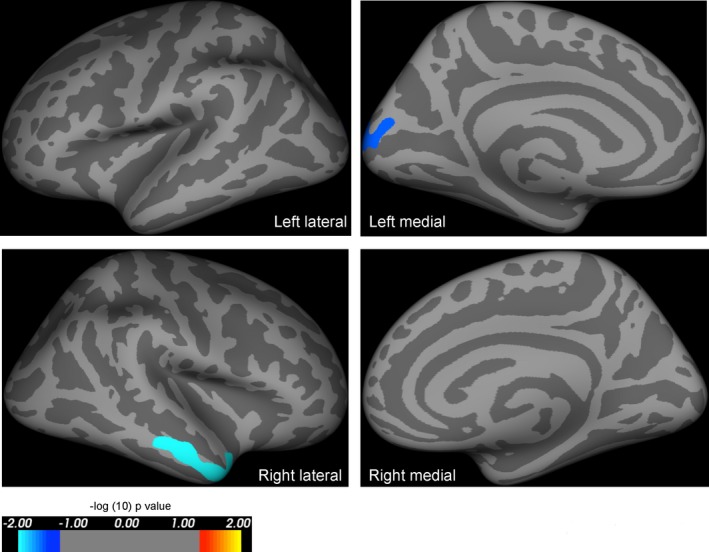
Figure 3.

Results of whole‐brain analysis comparing area in mildly affected PAX6 subjects versus controls, including age and intracranial volume as covariates of no interest. Highlighted regions represent significant reductions in cortical area in PAX6 subjects compared to controls, and were seen in the medial occipital lobe and middle temporal lobe in mildly affected PAX6 subjects compared to controls. The reduction in cortical area when compared to controls is less extensive than that seen in severely affected PAX6 subjects (see Fig. 4). All results are corrected for family wise errors. The P‐values of the clusters shown extend from 0.0001 (light blue) to 0.03 (dark blue), and are superimposed on lateral/medial views of the left/right inflated hemispheres derived from the Freesurfer FsAverage brain template made in MNI305 space. The coordinates and P‐values of the clusters are documented in Table 4.
